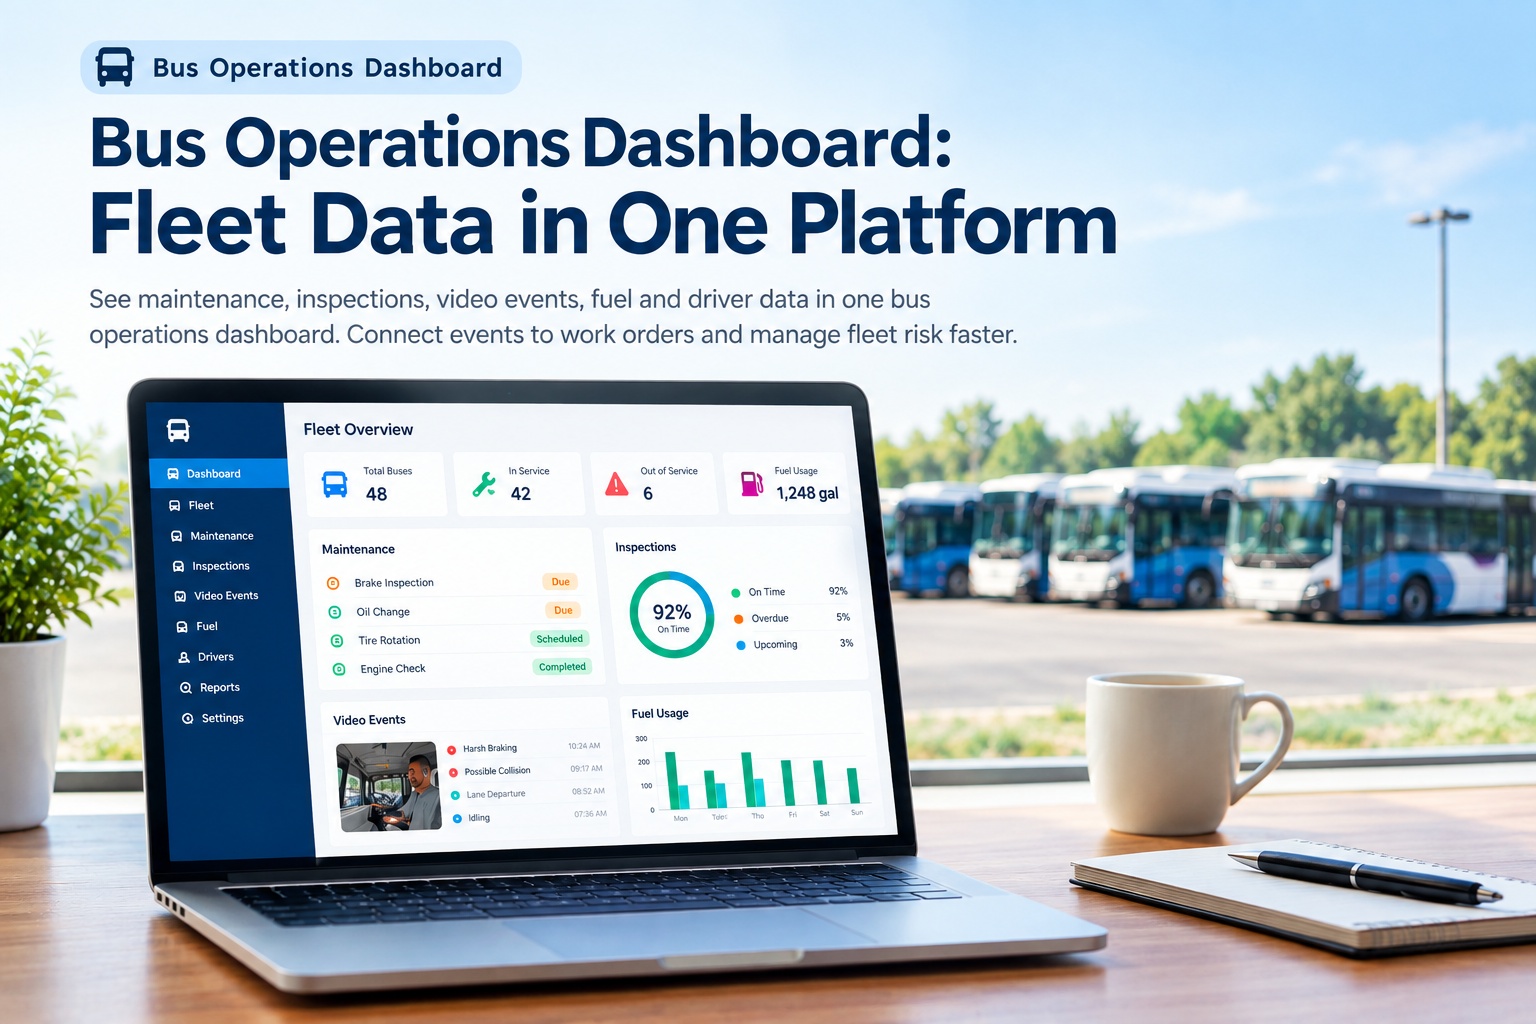
Ask your team which bus is costing you the most this month, and watch what happens next. One tab opens for the maintenance log. Another for the fuel cards. Someone pulls up last week's video-flagged events in a separate portal, and a spreadsheet gets built to stitch it all together. By the time there's an answer, the moment to act on it has usually passed. A single pane of glass puts maintenance, inspections, video events, fuel, and driver data on one screen — so the answer is there before you finish asking the question.
The Real Cost of Running on Five Systems
Disconnected tools don't just slow your team down — they hide the connections between events that actually matter, like a fuel spike that lines up with a maintenance issue nobody flagged yet.
What One Pane Actually Shows You
A dashboard is only useful if it connects the data, not just displays it side by side. Here's what a properly unified bus operations view brings together.
None of this replaces your telematics or camera provider — it sits on top of them. Sign up to connect your existing systems into one dashboard.
Expert Review: A Morning, Two Ways
Here's the same Monday morning, run two different ways — once across five disconnected systems, once from a single operations dashboard.
Built Around 49 CFR 396.3 and Your District's Fleet Policy
A unified dashboard is only as good as the records behind it. Every maintenance action surfaced on the pane is the same systematically retained record that 396.3 requires — vehicle identification, dates, and a description of the work performed — plus whatever additional inspection or reporting rules your district or agency layers on top. Book a demo to see how your district's fleet policy maps onto one dashboard.
The goal isn't another screen to check. It's replacing the four or five you're already checking with one that actually connects the dots between them. Sign up and bring your fleet data into one view this week.
Frequently Asked Questions
What is a "single pane of glass" for bus operations?
It's a single dashboard that brings together data that normally lives in separate systems — maintenance and work orders, inspections and defects, video-flagged events, fuel consumption, and driver or route data — so a manager can see everything about a bus, or the whole fleet, without switching between tools.
Does this replace our existing telematics or camera system?
No. A unified dashboard is built to sit on top of your existing telematics, camera, and fuel systems, pulling their data into one connected view rather than replacing the hardware or provider you already use.
How does a single dashboard help with 49 CFR 396.3 compliance?
Section 396.3 requires a systematic inspection, repair, and maintenance record for every vehicle, including dates and a description of the work performed. When that record is generated directly from the same dashboard your team uses daily, the compliance file builds itself instead of being assembled separately at audit time.
Can the dashboard reflect our district's specific fleet policies?
Yes. Beyond the federal baseline under 396.3, most transit agencies and school districts layer their own inspection intervals, reporting cadences, and sign-off requirements on top. A configurable dashboard is built to reflect those local policies, not just a generic federal checklist.
How long does it take to get a unified dashboard running?
Because it connects to systems you likely already have — telematics, cameras, fuel cards — most fleets see a working dashboard within a few weeks rather than a multi-month rollout, since the heavy lifting is integration, not new hardware installation.







