Direct answer: A spare bus ratio is your reserve buses divided by the buses you need at peak service. There is no universal federal number — you calculate a defensible one from your own downtime, seasonal peaks, and incident history.
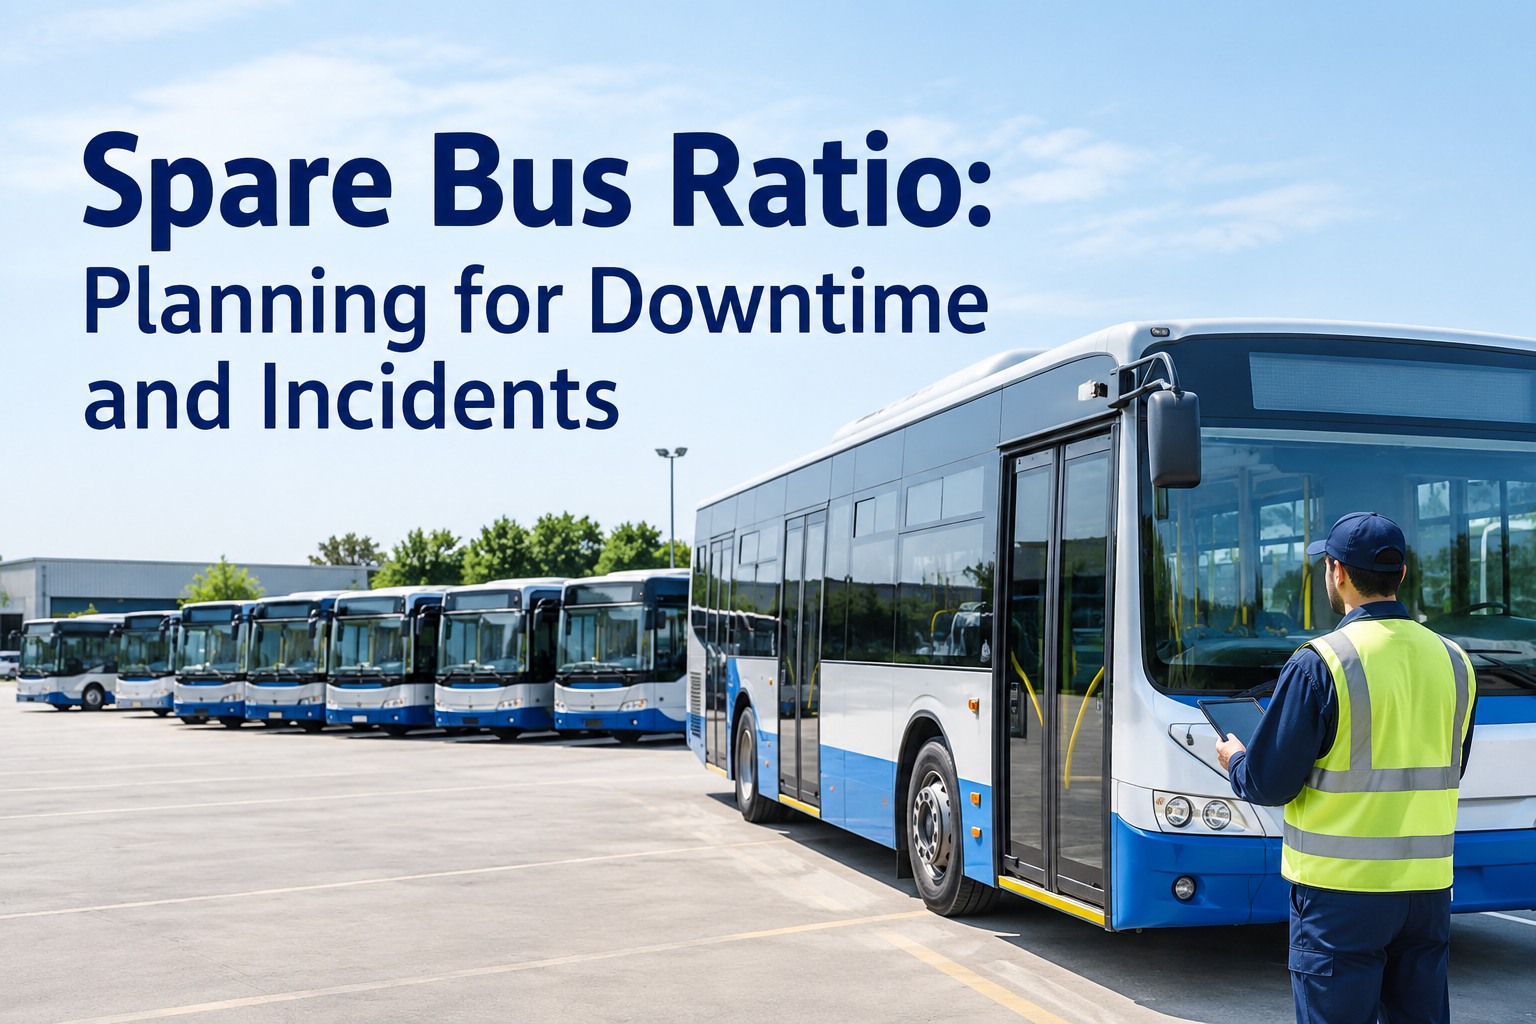
Spare Bus Ratio: Planning for Downtime and Incidents
The number that decides whether a bad morning is a shrug or a canceled route. Here is how to calculate it from your own fleet, not a rule of thumb.
Updated September 2026 · The FTA 20% figure below is a grant-program guideline for certain transit recipients, not a universal mandate.The formula is trivial. The judgment is in the numerator — deciding how many spares you actually need. That number is a function of four inputs, and every one of them lives in data your fleet already generates. Push these up and your ratio needs to climb; keep them low and you can run leaner safely.
The four inputs that drive the number
A spare ratio is really an answer to one question: on your worst realistic day, how many buses will be unavailable at once? These four inputs, read from your own history, tell you that.
Downtime history
How many buses are typically down at once for scheduled PM and unscheduled repairs. Your maintenance records already hold this — average it, then look at the peaks, not just the mean.
Seasonal peaks
Demand is not flat. Back-to-school, winter starts, event surges — the ratio has to cover your busiest service level, not your average one, or you fall short exactly when it hurts most.
Parts-delay risk
A bus waiting weeks on a back-ordered part is a spare you do not have. The longer and less predictable your parts lead times, the more reserve you need to absorb the wait.
Incident rate
Collisions and out-of-service safety defects pull buses without warning and often for a long time. Your incident history sets the buffer you need beyond planned downtime.
Notice all four are historical — you are not guessing, you are reading. The fleets that get the ratio wrong are usually the ones estimating from memory instead of from their own maintenance and incident records. Book a demo to see downtime and incident history in one place
A worked example: sizing spares for a 40-bus operation
Numbers make this concrete. Take a fleet that needs 40 buses on the road at peak service. Walk the four inputs, add them into a worst-realistic-day figure, and the ratio falls out. These figures are illustrative — the method is what transfers to your fleet.
A defensible spare ratio for this fleet — built from its own numbers, not borrowed.
Total fleet in this case is 48 buses: 40 to run peak service plus 8 spares. The exact same method might land another operation at 12% or 28% — a rural school district with predictable routes and reliable parts needs less reserve than a transit agency running around the clock through event surges. The point is not the number; it is that you can defend it, line by line, to a board or a CFO. Start free and build your ratio from your own downtime data
Now calculate yours
Use the same five lines with your own numbers. Pull them from your maintenance and incident records, not memory — that is what makes the result defensible. Fill the blanks, add the middle four, and divide the total by your peak-service figure.
Do this once a year against fresh data and the ratio stops being a guess you inherited and becomes a decision you can update as your fleet, routes, and parts reality change. Start free and let your downtime data fill this in automatically
What ratio does a fleet like yours land on?
The right number varies enormously by operation, which is exactly why copying someone else's ratio is risky. These illustrative ranges show why — a predictable rural route fleet and a round-the-clock transit system are not the same planning problem. Use them to sanity-check your worksheet result, not to replace it.
Relative illustration of how reserve needs scale, not published ratios. Your defensible number always comes from your own worksheet above.
The pattern is the reason there is no universal figure: the harder and less predictable the operation, the more reserve it needs. Reading your own history is the only way to land in the right band. Book a demo to benchmark your fleet against its own history
What the regulations actually say about spares
Here is where a lot of planning goes sideways, because people reach for a rule that does not exist. There is no federal safety regulation that sets a universal spare-bus ratio every fleet must hit. What exists is narrower and often misquoted.
A grant-program guideline, from FTA Circular 9030.1C, that applies to FTA recipients operating 50 or more fixed-route revenue vehicles — and it is a ceiling (spares should not exceed 20% of peak-service vehicles), not a required target. FTA allows latitude for local conditions. It does not apply to school bus fleets, charter operators, small transit, or anyone outside FTA funding.
This is about inspection, repair, and maintenance — keeping vehicles in safe operating condition and keeping the records to prove it. It says nothing about how many spares to hold, but it is why a spare only counts if it is actually maintained and documented. A "spare" that is itself overdue for inspection is not a spare.
So the honest position is: no universal ratio to copy, a specific FTA ceiling that may or may not apply to you, and a maintenance-records standard that determines whether your spares are real. Your defensible number comes from the calculation above — the regulations set guardrails, not the answer. Book a demo to keep every spare inspection-current and provable
The gap that quietly shrinks your real spare count
Here is the operational trap that undermines even a well-calculated ratio. Your cameras and MDVR catch things — a harsh event, a warning, a defect visible in footage. But that video lives in one system, and your maintenance lives in another. So a problem gets seen but never converted into a work order, or a work order gets opened but nobody can tie it back to the event that justified it. The bus keeps running until the problem escalates, and when it finally goes down, it takes a spare with it that your ratio assumed was free.
Closing this gap is what makes a spare ratio hold in practice. When a detected defect reliably becomes a tracked, closed work order, buses spend less time quietly deteriorating toward an unplanned failure — which is the failure a spare ratio is trying to absorb in the first place. BusCMMS is an AI-native, hardware-agnostic bus fleet operations platform that reads events from the MDVR or AI camera systems you already run and connects them to asset records and maintenance work orders, so downtime is visible, incidents are responded to, and every caught defect has a documented resolution. Start free and turn caught defects into closed work orders
See how a video event becomes a closed work order in BusCMMS
You have the formula and a worksheet to size your ratio — the last step is keeping those spares real. BusCMMS reads events from your existing MDVR or AI cameras, links them to the exact bus, and turns a caught defect into a tracked, closed work order, so downtime stays visible and spares do not quietly become permanent absences. Book a demo and watch a video event become a closed work order on your own fleet, or start free and let your downtime data build the ratio for you.
Hardware-agnostic · Works with your existing MDVR or AI cameras · One record per bus
Frequently asked questions
What is a spare bus ratio?
A spare bus ratio is the proportion of a fleet held in reserve to cover vehicles that are out of service, calculated as the number of spare buses divided by the number of buses needed for peak service, expressed as a percentage. Spares absorb both planned downtime (preventive maintenance and scheduled repairs) and unplanned losses (breakdowns, parts delays, and incidents). A ratio that is too low leads to canceled routes when several buses are down at once; one that is too high wastes capital and maintenance spend on rarely-used vehicles. The right ratio is calculated from a fleet's own operating history rather than copied from a generic figure.
Is there a required or standard spare bus ratio?
There is no universal federal safety regulation that sets a spare-bus ratio every fleet must meet. The commonly cited 20% figure comes from FTA Circular 9030.1C and applies specifically to Federal Transit Administration recipients operating 50 or more fixed-route revenue vehicles — and it functions as a ceiling (spares generally should not exceed 20% of peak-service vehicles), with FTA allowing latitude for local conditions. It does not apply to school bus fleets, charter operators, smaller transit systems, or operators outside FTA funding. Separately, 49 CFR Part 396 governs vehicle inspection, repair, and maintenance and the associated records, but it does not dictate how many spares to hold. In short, use your own calculation; treat the FTA figure as a guardrail only if it applies to you.
How do I calculate a defensible spare bus ratio?
Start with the buses you need on the road at peak service. Then, from your own records, estimate how many buses will be unavailable on a worst realistic day: typical vehicles down for preventive maintenance and unscheduled repairs, extra losses during your seasonal demand peak, buses held up waiting on back-ordered parts, and a buffer for collisions and out-of-service safety defects. Add those into a total spares figure, then divide by your peak-service number for the ratio. For example, a fleet needing 40 buses at peak that expects up to 8 unavailable on a bad day arrives at a 20% ratio and a 48-bus total fleet. The value of the method is that every input traces to real data, so the number is defensible to a board or CFO.
Why do camera and MDVR events matter for spare planning?
Because a spare ratio assumes that buses go down in predictable, manageable ways — and undetected or unaddressed defects break that assumption. Cameras and MDVR systems often capture early signs of a problem, but if that footage lives separately from your maintenance system, a defect can be seen and never converted into a work order. The bus keeps running until it fails unexpectedly, consuming a spare your plan assumed was available. Connecting camera and MDVR events to asset records and maintenance work orders means a caught defect reliably becomes a tracked, closed repair, so fewer buses deteriorate quietly toward the kind of surprise failure that spares exist to absorb.
Does BusCMMS require replacing our cameras?
No. BusCMMS is hardware-agnostic. It is designed to read events from the MDVR or AI camera systems you already operate and connect them to the correct asset record and a maintenance work order, rather than requiring you to install a specific camera ecosystem. The goal is to close the gap between detection and repair — so a defect visible in your existing footage becomes a documented, closed work order — and to keep downtime, incidents, and maintenance history on one operational record per bus, which is what makes a calculated spare ratio hold up in day-to-day operation.