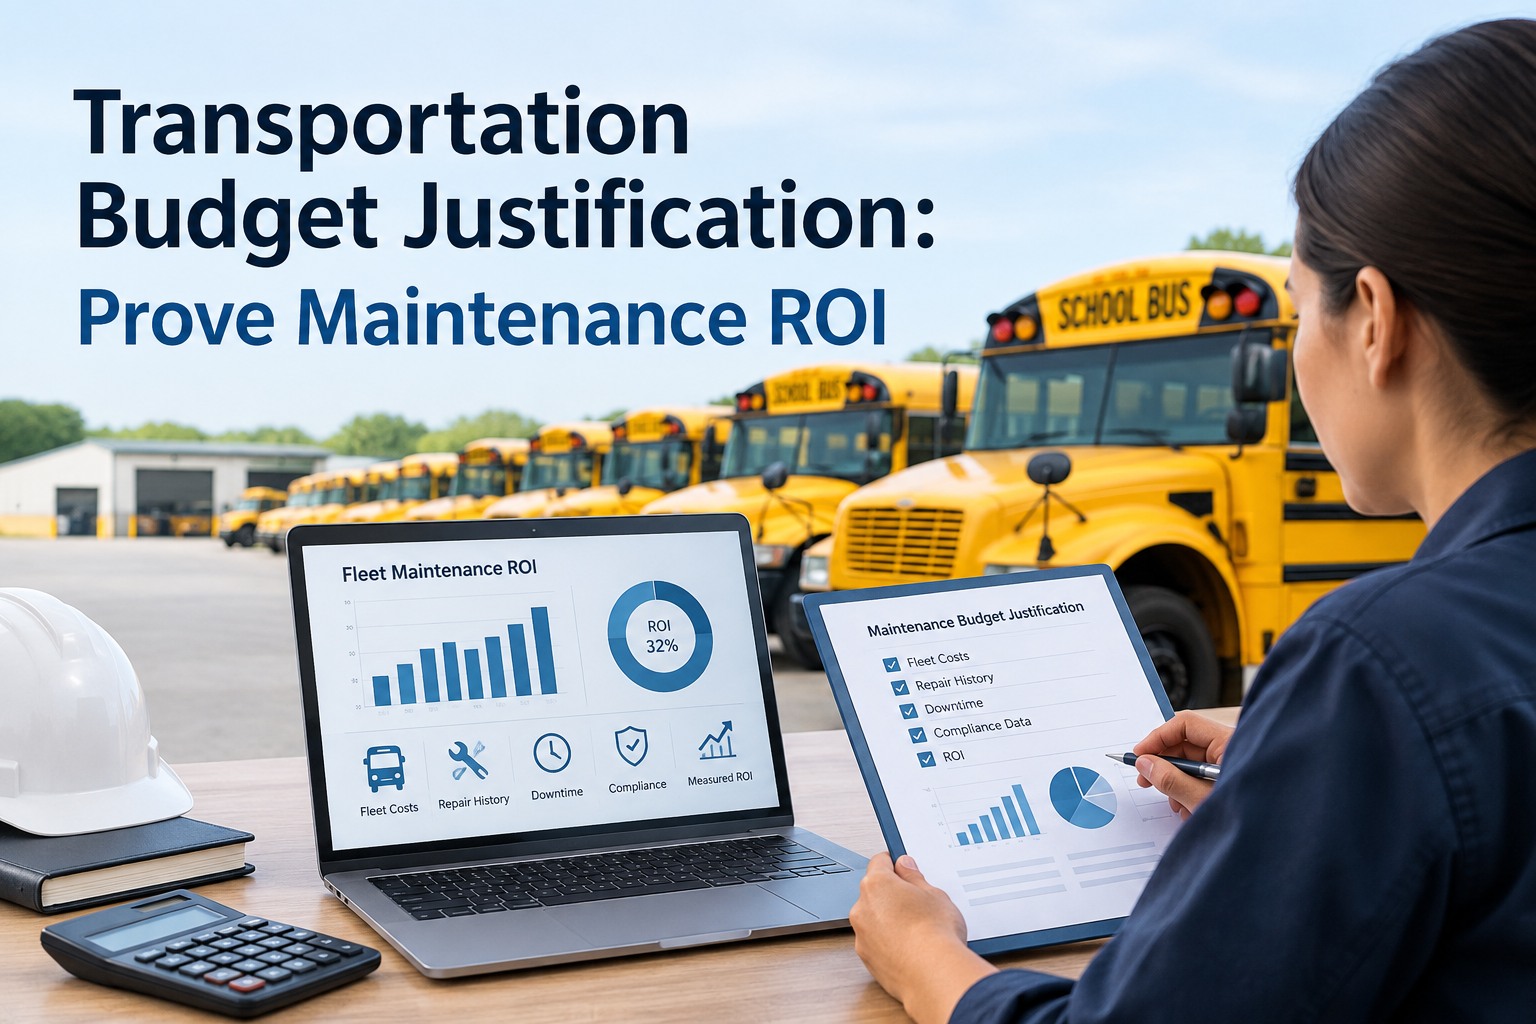
The board looks at your maintenance line, sees a big number with no story attached, and asks the question every director dreads: "Can we cut this?" If your answer is "we really need it," you have already lost. Transportation budget justification separates a budget approved on the first pass from one that gets questioned and trimmed. The fleets that keep their funding in 2026 walk in with twelve months of data and a number they can defend line by line.
Transportation Budget Justification: Build a Case the Board Can't Cut
Why "last year plus five percent" fails, the four metrics that make a budget credible, and how to turn a cost line into a funded investment.
Credibility is what gets funded
Why "Last Year Plus Five Percent" Gets You Cut
The traditional budgeting model -- take last year's number and add a few percent -- is failing directors in 2026, and boards know it. It carries no explanation, so it reads as a guess. And a guess is the easiest thing in the room to cut, because nobody can say what breaks if it goes.
The pressure is real this year. Districts face 4.2% inflation, fuel swings up to $0.60 a gallon in a single month, and maintenance costs up 12% since 2024 -- with some already spending several times their original allotment. Entire 2026 conference sessions were dedicated to the "fiscal cliff" and making the funding case before cuts get finalized.
Against that backdrop, an unexplained number does not survive. What survives is a budget built from actual data, analyzed for what drives each dollar, and presented so every increase has a documented reason. That is the whole shift transportation budget justification demands -- from "trust me" to "here is the evidence." You can book a demo to see how BusCMMS turns 12 months of fleet data into that evidence.
The Four Numbers That Make a Budget Credible
Credibility comes from data, and four metrics carry most of the weight. Pulled from twelve months of maintenance records, they turn a budget request into a defensible forecast that a finance office can stress-test and still approve.
Cost Per Bus-Year
Total maintenance spend divided by fleet size. The baseline every projection builds on -- and the number the board recognizes.
Lifecycle Cost Curve
How cost rises with fleet age -- roughly $400 per bus per year of age. This is how you justify an increase on an aging fleet.
PM-to-Reactive Ratio
The share of planned vs. emergency work. It proves your spend is disciplined, not wasteful -- the answer to "are you managing this?"
Seasonal Variance
Your monthly spend pattern -- school buses spike in August, transit in winter. It explains why Q1 costs more than Q3.
Each metric answers a question the board is already thinking. Cost per bus-year sets the baseline, the lifecycle curve justifies increases, the PM ratio proves discipline, and seasonal variance explains the timing. Together they replace "we need more" with a forecast built on evidence. Our cost-per-mile guide covers how to calculate the baseline metric cleanly.
The Trade-Off Argument That Wins Every Time
When maintenance gets scrutinized, the instinct is to defend the number. The stronger move is to reframe it as a trade-off the board can do the math on themselves -- and BusCMMS gives you the figures, tagging every work order planned or emergency. Cutting preventive maintenance is not a saving; it is a cost transfer to a bigger, later line.
That single line -- "increasing PM by $40K reduces emergency repairs by $60K, net $20K saved" -- does what no plea can: it shows the board that maintenance is not a cost to minimize but a lever that lowers total spend. Run the same math on any PM item and the rigorous schedule wins every time. You can sign up free and pull your own planned-vs-emergency numbers.
Explaining Why This Year Costs More Than Last
The moment your budget is higher than last year's, the board wants to know why. A credible variance analysis answers that before they ask -- showing the increase is driven by documented factors, not wishful thinking. This is the single strongest defense against a cut, because it removes the suspicion that the number is padded.
- AGE
Fleet Aging
"Average bus age rose from 5.2 to 5.8 years -- at ~$400 per bus per year of age, that alone adds a defined, unavoidable amount."
- INFL
Parts & Labor Inflation
"Parts costs rose 12% since 2024, documented on our invoices -- not a projection, an observed trend."
- SVC
Service Growth
"Added routes or mileage this year raise total maintenance load proportionally -- shown against per-mile cost held flat."
- SAVE
Offsetting Savings
"Here is what we cut -- warranty recovery, reduced emergency spend -- so the net increase is smaller than the gross."
The last item is what separates a strong director from an average one. Showing the board what you saved alongside what you need proves you are managing the budget, not just spending it. A request that says "costs rose $180K from documented factors, and we offset $70K through better PM and warranty capture" is nearly impossible to cut without looking reckless.
Building the Case, in the Right Order
Data alone does not win the room -- sequence does. The order you present in determines whether the board sees a well-run operation asking for what it needs, or a cost center asking for more. Here is the flow that gets a first-pass approval.
Notice the bookends. You open on what the money already delivered and close on student and passenger safety -- the one argument a board will not be seen voting against. The data in the middle earns the credibility, and BusCMMS exports it in board-ready format so the whole sequence assembles in one click. You can sign up free and start assembling your case from real data.
Your Budget-Meeting Readiness Checklist
Before you walk into the room, run this checklist. Each item is something a data-backed director has ready -- and each maps to a report BusCMMS produces automatically, so "having it ready" is one click, not a week of spreadsheet work.
- Cost per bus-year, pulled from real recordsBusCMMS cost-per-bus analytics
- Your PM-to-reactive ratio, proving disciplinePlanned-vs-reactive split
- Age-vs-cost curve behind every increaseAge-vs-cost modeling
- Seasonal spend pattern to explain the timingSeasonal trend charts
- Documented savings to offset the net askWarranty & savings capture
- A board-ready packet, formatted and exportableOne-click board exports
If you can check all six, your budget is defensible before anyone asks a question. If you cannot, that is exactly the gap a bus-specific CMMS closes -- it keeps every one of these ready year-round. You can book a demo to see the full checklist populated with your fleet's data.
How BusCMMS Builds Your Budget Justification
Every credible budget rests on twelve months of clean per-bus data -- and that is exactly what most fleets lack when the meeting arrives. BusCMMS is built for buses and captures it automatically, so the justification is assembled from real records, not rebuilt from memory each cycle. These are the capabilities behind it.
Cost-Per-Bus Analytics
Total and per-bus maintenance cost, refreshed monthly -- the baseline number your entire budget builds on.
Planned-vs-Reactive Split
Your PM ratio tracked continuously -- the proof of discipline that answers "are you managing this spend?"
Seasonal Trend Charts
Monthly spend patterns over 12+ months, so you can explain and forecast why some quarters cost more.
Age-vs-Cost Modeling
The lifecycle curve that ties rising cost to fleet age -- your documented justification for an increase.
Warranty & Savings Capture
Documented recoveries and avoided emergency cost -- the offsetting savings that shrink your net ask.
Board-Ready Exports
One-click variance analysis, trade-off math, and trend charts -- the whole justification, formatted for the packet.
Budget analytics is one of the highest-ROI uses of a CMMS, because the difference between a cut budget and an approved one is credibility -- and credibility is just data, organized. Fleets that present twelve months of clean records win approval on the first pass. See it on your fleet -- book a demo and get your budget justification built from your data.
Credibility Is the Whole Game
A budget built on assumptions gets questioned, cut, and typically ends the year over-budget anyway. A budget built from twelve months of data, analyzed for variance, and presented with a clear trade-off wins approval on the first pass. The difference is not the size of the ask -- it is whether you can prove it.
- Drop "last year + 5%" for a data-built forecast
- Lead with the four credibility metrics
- Frame maintenance as a trade-off, not a cost
- Tie every increase to a documented driver
Do that and the budget meeting stops being a fight you brace for and becomes a presentation you walk into confident -- because the numbers, not your negotiating skill, make the case. That is transportation budget justification done right: funding secured, on the record, first pass.
Frequently Asked Questions
What is transportation budget justification?
Transportation budget justification is the practice of defending a fleet or maintenance budget with data rather than assumptions -- showing exactly what each dollar buys, why costs are what they are, and what would break if the budget were cut. For a bus fleet it combines four metrics (cost per bus-year, the lifecycle cost curve, the PM-to-reactive ratio, and seasonal variance) with a variance analysis that ties every increase to a documented driver. The goal is credibility: a budget built from real records gets approved on the first pass, while one built on "last year plus a few percent" gets questioned and cut.
How do you justify a fleet maintenance budget to a board?
Lead with results (what last year's budget delivered in uptime, safety, and savings), show the baseline metrics (cost per bus-year and PM ratio), explain the variance (tie every dollar of increase to a documented factor like fleet aging or parts inflation), frame the trade-off (show that cutting PM costs more than it saves), and close on safety. The strongest single move is the trade-off math -- for example, "increasing PM by $40K reduces emergency repairs by $60K, a net $20K saving" -- which reframes maintenance as a lever that lowers total cost rather than a line to minimize.
Why does the "last year plus 5 percent" budget model fail?
Because it carries no explanation, so it reads as a guess -- and a guess is the easiest thing in the room to cut. It also fails to account for real 2026 pressures: 4.2% inflation, fuel swings up to $0.60 a gallon in a month, vehicle maintenance costs up 12% since 2024, and aging fleets that add roughly $400 per bus per year of age. An unexplained number cannot answer "why is this higher?" or "what breaks if we cut it?" A budget built from twelve months of maintenance data can answer both, which is why it survives scrutiny while the incremental model does not.
What is variance analysis in a transportation budget?
Variance analysis explains why the new budget differs from last year's actual spending, tying each change to a documented cause instead of leaving it as an unexplained increase. Typical drivers include fleet aging (average age rising adds a defined per-bus cost), parts and labor inflation (observed on invoices, not projected), and service growth (added routes or mileage). The most persuasive version also shows offsetting savings -- warranty recoveries and reduced emergency spend -- so the board sees the net increase is smaller than the gross. A request backed by variance analysis is very difficult to cut without appearing reckless.
How does BusCMMS help justify a transportation budget?
BusCMMS captures twelve months of per-bus maintenance data automatically and turns it into the four metrics a credible budget needs: cost per bus-year, the age-vs-cost lifecycle curve, the planned-vs-reactive ratio, and seasonal spend patterns. It documents warranty recoveries and avoided emergency costs as offsetting savings, and its board-ready exports package the variance analysis, trade-off math, and trend charts for the budget packet in one click. Instead of rebuilding the case from memory each cycle, the justification assembles itself from real records -- which is why data-backed budgets win approval on the first pass.