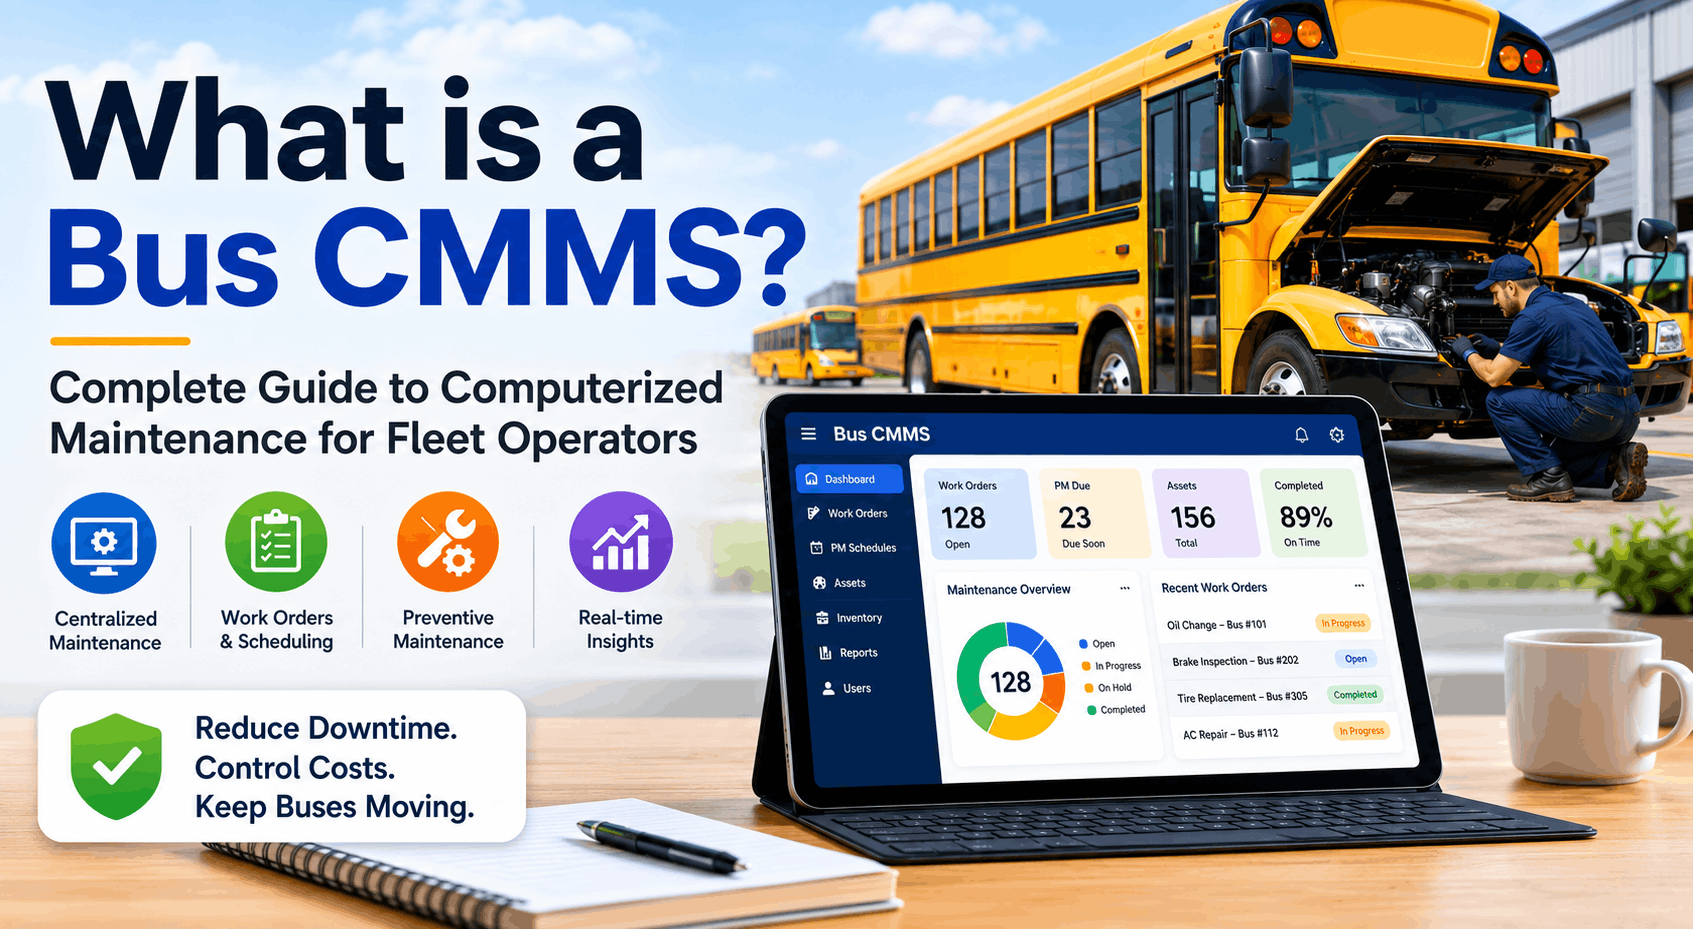
A Bus CMMS (Computerized Maintenance Management System) is specialized software designed specifically for school buses, transit buses, and charter coaches that automates and tracks preventive maintenance scheduling, work order management, parts inventory, regulatory compliance (FMCSA/FTA/state DOT requirements), driver vehicle inspections (DVIRs), cost tracking, and fleet analytics. Unlike generic CMMS platforms built for manufacturing equipment or construction vehicles, a purpose-built bus CMMS includes pre-loaded federal inspection forms matching FMCSA DVIR requirements, fuel-type specific preventive maintenance schedules (diesel vs. compressed natural gas vs. electric), integrated telematics connectivity, driver safety monitoring, real-time GPS tracking, and school district or transit agency pricing models. This comprehensive guide explains what a bus CMMS is, how it works, why bus fleet operators choose it over spreadsheets and generic software, includes detailed feature breakdown with real data from 40,000+ monitored buses, step-by-step implementation guidance for beginners, complete ROI calculations, and honest assessment of which fleets benefit most from CMMS investment and which can delay.
What is a Bus CMMS? Complete Guide to Computerized Maintenance for Fleet Operators
Learn what a Bus CMMS is, how it works, and why bus fleet operators choose it over spreadsheets. Includes feature breakdown, ROI data, and step-by-step setup guide for beginners.
What is a Bus CMMS? The Definition and Core Functions
A Bus CMMS is software that automatically tracks and schedules preventive maintenance for bus fleets, replacing manual spreadsheets and email reminders. The system captures every maintenance activity—from scheduled oil changes to emergency repairs—in a centralized database with real-time visibility. When a bus is due for maintenance based on mileage or calendar days, the CMMS automatically generates a work order. When a driver submits a digital inspection report (DVIR), the system flags any defects and routes them to maintenance. When technicians complete repairs, the system updates vehicle history, adjusts costs, and verifies compliance. Unlike spreadsheets where maintenance records scatter across email and filing cabinets, a CMMS creates a single source of truth for every vehicle's maintenance history, compliance status, and cost profile. A purpose-built bus CMMS includes features spreadsheets and generic software cannot: federal DVIR forms pre-loaded and compliant with FMCSA regulation 49 CFR 396, PM schedules that automatically adapt to vehicle fuel type (a diesel bus gets different service intervals than an electric bus), telematics integration that pulls odometer readings from the vehicle eliminating manual entry, driver safety monitoring that flags risky behaviors before accidents, and automated reporting for DOT compliance audits. The software is accessed via web dashboard (for managers), mobile app (for drivers and technicians), and automated reporting (for compliance officers). Cost ranges from $8-$25 per bus per month depending on fleet size and feature set, with ROI typically realized within 4-8 months through maintenance cost reduction and accident prevention.
Why Spreadsheets Fail: The Real Cost of Manual Maintenance Management
Spreadsheets rely on manual date entry. Supervisors must remember to check the spreadsheet and manually assign work. A PM due date slips by 2 weeks before anyone notices. By then, the bus operates on degraded brakes or worn tires, increasing accident risk and emergency repair costs. Studies show 25-30% of preventive maintenance slips past due date in spreadsheet systems.
DVIR forms are printed, filled by hand, filed in storage, and lost. State DOT auditors ask for DVIR history. You spend three days hunting through filing cabinets. Half the forms are missing or illegible. Documentation gaps put the district at compliance risk. Digital CMMS stores every inspection report with timestamp authentication, searchable and audit-ready.
You don't know your actual cost per mile. Spreadsheets track total spend but not costs at the vehicle level. One bus costs $1.20/mile to maintain while the fleet average is $0.55. You don't realize it until year 6 when the bus is truly broken down. Replacement decision delayed costs $20,000+ in extended repairs.
Technicians don't know what parts were already ordered. They order brake pads. Two weeks later, the first order arrives. Same technician orders again. You end up with duplicate parts, excess inventory, and wasted money. No system for optimal ordering or vendor consolidation.
Without preventive maintenance, buses break down randomly. A transmission fails mid-route. Bus is out of service for two weeks. You rent a substitute vehicle at $200/day. Total cost of that one breakdown: $3,500+. CMMS-managed fleets with 95% PM compliance see 50%+ fewer emergency repairs.
Should this bus be replaced or repaired? Spreadsheets don't give you the answer. You guess. You repair a bus beyond economic repair or retire a bus that had years of life left. CMMS data reveals the cost curve: when maintenance cost exceeds 50% of replacement value annually, it's time to retire.
How Bus CMMS Works: The Workflow From Vehicle Inspection to Compliance Report
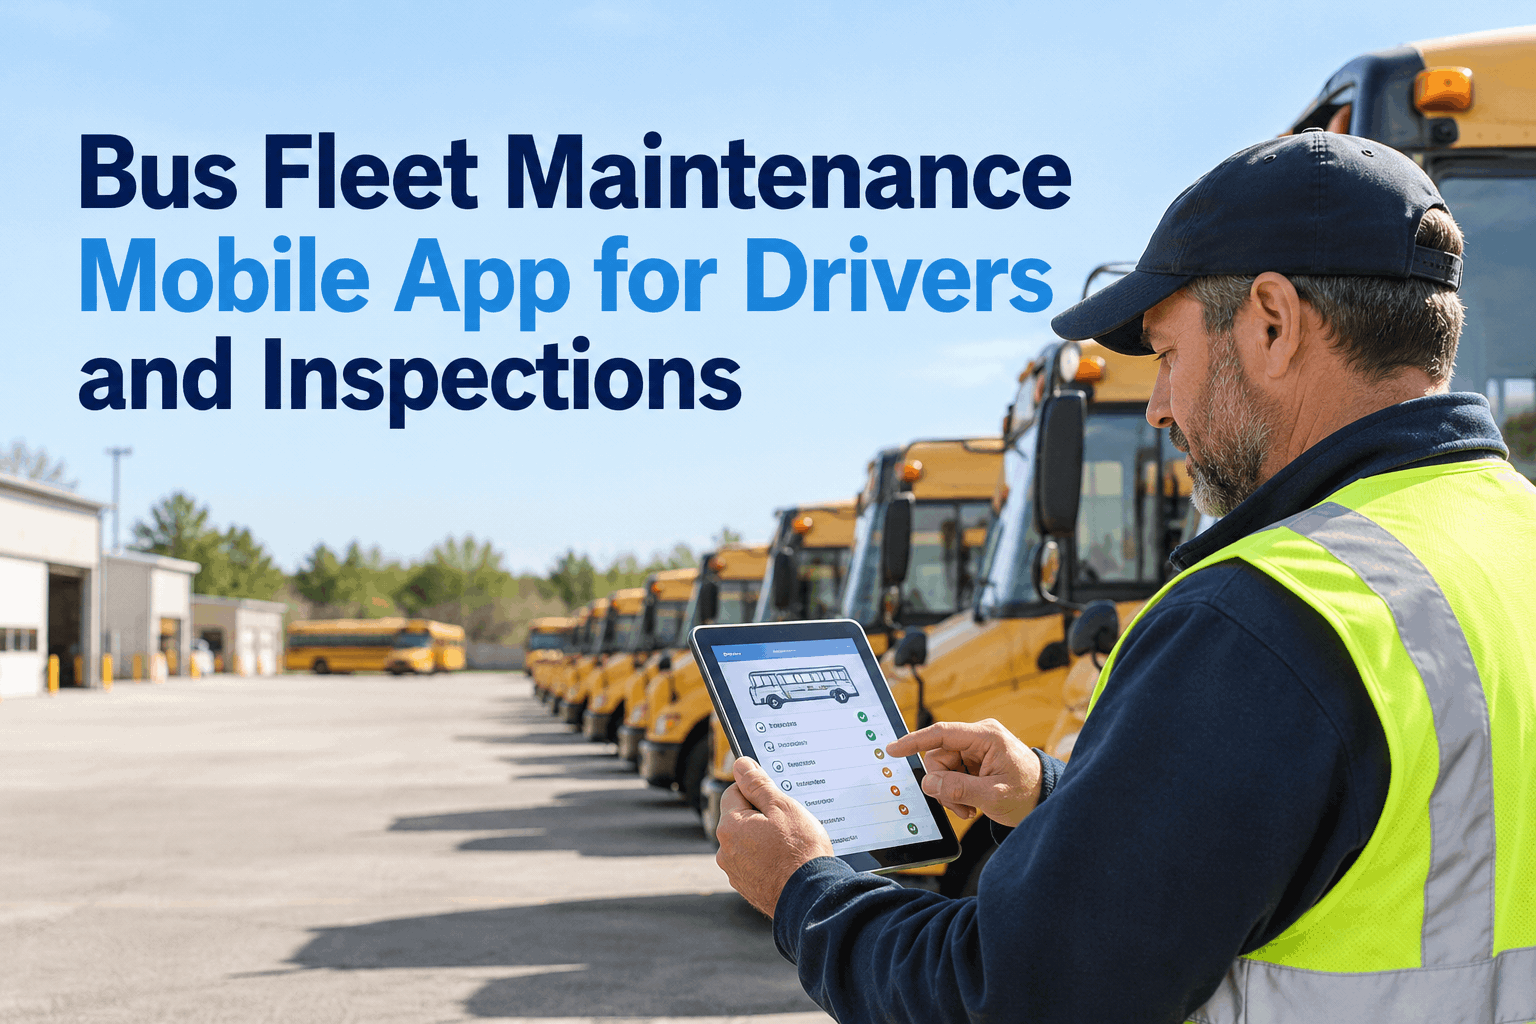
Driver uses mobile app to complete pre-trip inspection. App displays bus-specific form: check lights, mirrors, wipers, brakes, emergency exits, stop arm function, passenger accessibility. Driver taps through guided checklist. Any defects are photographed. Completed DVIR submitted instantly (online) or queued for submission when connected (offline mode). System records timestamp, driver ID, vehicle ID, GPS location.
Defect flags in DVIR trigger automatic routing: Critical safety issue (failed brakes) → Immediate alert to maintenance supervisor. Non-emergency defect (horn needs repair) → Work order created, scheduled into maintenance backlog. System checks against recent work orders to avoid duplicate repairs. Technician receives notification via dashboard and mobile app.
Fleet manager sets PM schedule: oil change every 10,000 miles or 60 days (whichever comes first). Electric bus battery health check every 20,000 miles. Air filter replacement every 15,000 miles. System pulls mileage from telematics or GPS data automatically. When trigger is met, work order automatically creates. No manual effort. System prioritizes by due date and severity.
Technician receives work order via mobile app. Checklist shows: parts required, estimated time, step-by-step instructions. Technician scans QR code on vehicle. Completes work. Photos evidence of repair. Logs actual time spent. Logs parts used from inventory system. Submits completion. System updates vehicle maintenance history, calculates cost, verifies PM compliance.
System calculates cost per mile automatically: total maintenance cost for vehicle ÷ total miles driven = cost per mile. Tracks by vehicle, route, fuel type, vehicle age. Dashboard shows which buses are over-budget. Alerts when cost per mile exceeds safe thresholds. Historical cost data informs replacement timing and budget planning.
System generates audit-ready compliance reports: FMCSA DVIR retention (required 3 months minimum) ✓. PM completion rates by vehicle. Defect response times. Safety audit trails. State DOT inspector requests records. Manager clicks "Generate Audit Report" and delivers complete documentation proving compliance. No scrambling through filing cabinets.
Core Features Every Bus CMMS Must Include
Pre-loaded federal inspection forms covering all FMCSA required items: exterior lights (headlights, taillights, turning signals, brake lights), mirrors and reflectors, horn, windshield wipers, windows, windshield, parking brake, service brake, brake hoses and tubing, coupling device, wheels and rims, tires, cargo securement, coupling devices, emergency equipment, stop arms (school buses), crossing gates (school buses), safety equipment, and accessibility features. Drivers use mobile app to check items and flag defects with photos. Forms are compliant with 49 CFR 396 DVIR requirements.
Different buses require different maintenance: Diesel buses get traditional engine oil/filter, transmission service, and emissions component checks. Compressed natural gas (CNG) buses get pressure vessel and fuel regulator checks specific to natural gas. Electric buses get battery state-of-health monitoring, thermal management checks, and high-voltage system inspections. One CMMS manages all three within a single system, applying the correct PM profile to each vehicle type automatically.
Drivers complete inspections on phones/tablets with guided forms, photo capture, and offline capability. Technicians receive work orders, execute repairs, and log completion via mobile app in the shop or on the road. Administrators manage fleet via desktop dashboard. Mobile apps must be intuitive because user adoption determines ROI. Poor mobile UX = 40% adoption; excellent mobile UX = 85%+ adoption.
Connects to GPS systems (Samsara, Geotab, Zonar) and vehicle diagnostics (OBD data) to automatically capture mileage, fault codes, and location. Eliminates manual odometer entry. Enables predictive maintenance based on actual vehicle performance, not guesses. Real-time visibility into vehicle location and status. Integrates diagnostics directly into maintenance platform.
Automatically calculates maintenance cost per mile for every vehicle: includes parts, labor, outside services, and emergency repairs. Dashboard shows cost trend over time. Alerts when cost per mile exceeds safety thresholds. Reveals which vehicles are over-budget vs. under-budget. Historical cost data informs vehicle replacement decisions: when cost per mile exceeds 50% of replacement value annually, retire the bus.
Generates audit-ready reports for FMCSA (federal), FTA (transit agencies), state DOT, and school district compliance officers. Reports show: DVIR completion rates, PM compliance rates, defect response times, corrective action taken, certification status. Digital storage of all inspection and maintenance records with timestamp authentication. Eliminates paper-based compliance gaps.
Tracks parts in stock and parts on order. When technician completes repair, parts used are logged automatically, reducing inventory. When inventory drops below threshold, system alerts for reorder. Prevents duplicate parts ordering and excess inventory waste. Shows which parts are most frequently replaced, informing vendor negotiations.
Dashboard shows critical metrics: PM compliance rate (target 95%+), MTBF (mean time between failures, target increasing), MTTR (mean time to repair, target decreasing), fleet uptime percentage, cost per mile by vehicle, scheduled vs. unscheduled maintenance ratio (target 80% scheduled), accident rate trends. Real-time alerts when metrics fall below targets. Historical trending reveals operational improvements.
Bus CMMS vs. Spreadsheets: Real Numbers Comparison
Build formulas, structure data, configure forms
Import vehicle list, activate pre-loaded forms
Drivers avoid digital entry; technicians use ad hoc notes
Mobile-first design matches natural workflow
Manual tracking misses 25-30% of due dates
Automatic scheduling and alerts ensure execution
Reactive maintenance; hidden costs not tracked
Preventive maintenance; all costs tracked
Unplanned breakdowns cause extended downtime
Preventive maintenance reduces emergency repairs
Missing DVIR records and documentation gaps
Complete digital audit trail, audit-ready reports
Time lost to searching for parts, info, work orders
Mobile work orders and pre-staged parts reduce delays
Real ROI Example: 40-Bus School District Year One
Step-By-Step Implementation Guide: From Day One to Positive ROI
1. Executive Kickoff Meeting - Senior staff (transportation director, maintenance supervisor, IT) align on goals, timeline, expectations. Budget approval confirmed. Champions identified.
2. Vehicle Data Prep - Export vehicle list (VIN, unit number, make/model/year, fuel type, current mileage). Import into CMMS. System creates vehicle records with pre-loaded inspection forms and maintenance schedules automatically.
3. Historical Data Optional - Digitize recent maintenance records (optional; not required for launch). Most fleets skip this to accelerate deployment. CMMS tracks all future maintenance automatically.
1. Driver Meeting - 30 minutes explaining CMMS purpose (safer buses, fewer breakdowns, better maintenance). No punishment focus. Demo eDVIR app on phones. Show how simple it is (5 taps, submit).
2. Live Walk-Through - One driver completes DVIR on actual bus while others watch. Q&A. Emphasize offline mode: "App works even if no cell signal; automatically submits when you get signal."
3. Paper Backup Period - First week, drivers complete both digital DVIR (new) and paper (old) in parallel. Builds confidence. By week two, paper backups discontinued.
1. Technician Half-Day Training - Show work order dashboard. Demo mobile work order app. Explain how to log parts and time. Practice with low-stakes work order.
2. Maintenance Supervisor Training - Full day. Dashboard navigation. KPI interpretation. Work order prioritization. Report generation. Compliance documentation.
3. Data Review - Check that mileage and defects from first week's driver DVIRs look reasonable. Address any data quality issues (missing fields, incorrect vehicle assignments).
1. Go Live - Discontinue paper processes. All work is now digital. System is the source of truth.
2. Daily Monitoring - Check adoption metrics daily. How many drivers completed DVIRs? Any adoption barriers? Address issues in real time.
3. PM Scheduling Activation - System begins auto-generating PM work orders based on mileage and calendar triggers. Technicians receive first batch of preventive maintenance work.
1. Cost Per Mile Reports - System calculates real cost per mile for each vehicle. Managers identify over-budget vehicles and investigate causes.
2. PM Compliance Analysis - Reports show which PM work orders were completed on time vs. late. Identify scheduling gaps. Adjust PM intervals if needed.
3. First Maintenance Cost Savings Visible - Emergency repairs declining. PM is preventing breakdowns. Cost reduction trends appear in dashboards.
1. Accident Prevention Impact - If safety monitoring is active, you'll see reduced accident rate trends (3-6 month lag for statistical significance).
2. Vehicle-Level Decision Data - Which buses are maintenance nightmares? Which are reliable? Cost per mile data informs replacement vs. repair decisions.
3. ROI Realization - Year-to-date cost savings compared to historical baseline. Typically 20-25% visible by month 6.
1. Annual ROI Report - 25-35% total cost reduction documented. Prevented accidents quantified. Uptime improvement measured.
2. Staff Retention Benefit - Better-maintained buses, clearer work assignments, improved efficiency often improve technician retention and driver satisfaction.
3. Strategic Planning for Year 2 - Driver safety monitoring expansion. Predictive maintenance enhancement. Route-level cost optimization. Budget planning based on real data.
Ready to Understand Your Fleet's Full Maintenance Picture?
See exactly how much you're spending per mile, where breakdowns happen, and how much a CMMS could save your fleet. Get personalized ROI projection in 15 minutes.
Bus CMMS Features Explained: What Each Capability Actually Does
When vehicle odometer hits 10,000 miles since last oil change, system automatically generates work order. No manager remembering. No manual date math. System integrates telematics (GPS) data to pull odometer automatically. Eliminates guessing "when was that oil change?" Enables predictive maintenance before failure.
Driver completes DVIR on bus with no cell signal. Data stored locally on phone. When bus returns to depot with WiFi, app automatically syncs. Critical for rural routes or areas with poor connectivity. Ensures compliance doesn't depend on signal strength.
System tracks DVIR retention requirement (must keep 3 months minimum per FMCSA). When DVIR approaches 90-day deletion threshold, system prevents deletion and alerts compliance officer. No accidental record loss. No audit failures from incomplete documentation.
System prioritizes work by urgency: Safety-critical defect (failed brakes) = immediate. High-priority maintenance (near due date) = schedule this week. Low-priority repairs (cosmetic) = schedule when convenient. Prevents technicians wasting time on urgent items hidden in big backlog.
Historical cost data shows when bus moves into expensive maintenance territory. Typical bus remains cost-effective until 10-12 years old or 250,000 miles. Beyond that, maintenance cost per mile accelerates. CMMS data shows exact point when replacement is more economical than repair.
System tracks which parts are ordered from which vendors. Reveals consolidation opportunities. "We're buying brake pads from three different vendors. Let's consolidate to one for better pricing." Single vendor relationship can cut parts cost 8-12%.
Frequently Asked Questions About Bus CMMS Implementation
Can existing spreadsheets be imported into CMMS?
What if drivers refuse to use the mobile app?
How does CMMS handle electric buses alongside diesel?
Is CMMS FERPA compliant for school buses?
How long does a full fleet audit take with CMMS?
Can technicians work on multiple work orders simultaneously?
What's the cost difference between small fleet (20 buses) and large fleet (200 buses) pricing?
Can CMMS integrate with accounting software like QuickBooks?
Which Fleets Benefit Most From Bus CMMS?
Best candidates for CMMS: school districts with 25+ buses, transit agencies of any size, charter operators with 15+ vehicles, and private operators with mixed fleets. These fleets have sufficient scale to justify software investment and enough complexity that spreadsheets fail. Fleets with 5-10 buses might find spreadsheets adequate if discipline is high and technician expertise is strong, but even small fleets achieve faster ROI from CMMS because a single prevented accident pays for years of software. The worst candidates: extremely small operations (under 5 buses) managing vehicles with minimal maintenance due to age/model, and fleets with highly inconsistent technician workforce unable to adopt digital workflows. For everyone else, CMMS ROI is mathematically obvious within 4-8 months.
Next Steps: From Evaluation to Implementation
If you're evaluating bus CMMS for your fleet, the process is straightforward: (1) Define your current state (how many buses, fuel types, current pain points, current cost metrics). (2) Request free ROI assessment from vendor showing your specific cost reduction potential. (3) Schedule demo with live data showing how system handles your vehicle types. (4) Verify integration with your existing telematics platform. (5) Request reference checks with similar-sized fleets. (6) Request implementation timeline estimate. (7) Negotiate pricing based on fleet size and feature requirements. (8) Execute pilot program with one garage location before fleet-wide rollout. Most successful implementations follow this discipline rather than rushing to launch. Visit buscmms.com to start your evaluation, request a demo, or book a free consultation with a fleet specialist.
We were using Excel spreadsheets for maintenance tracking. Buses broke down randomly. We didn't know cost per mile. Compliance audits were stressful. After four months with BusCMMS, downtime dropped 45%, we prevent maintenance issues before they happen, and compliance is automatic. The biggest shock: the system paid for itself in the first prevented breakdown. I should have implemented this years ago.