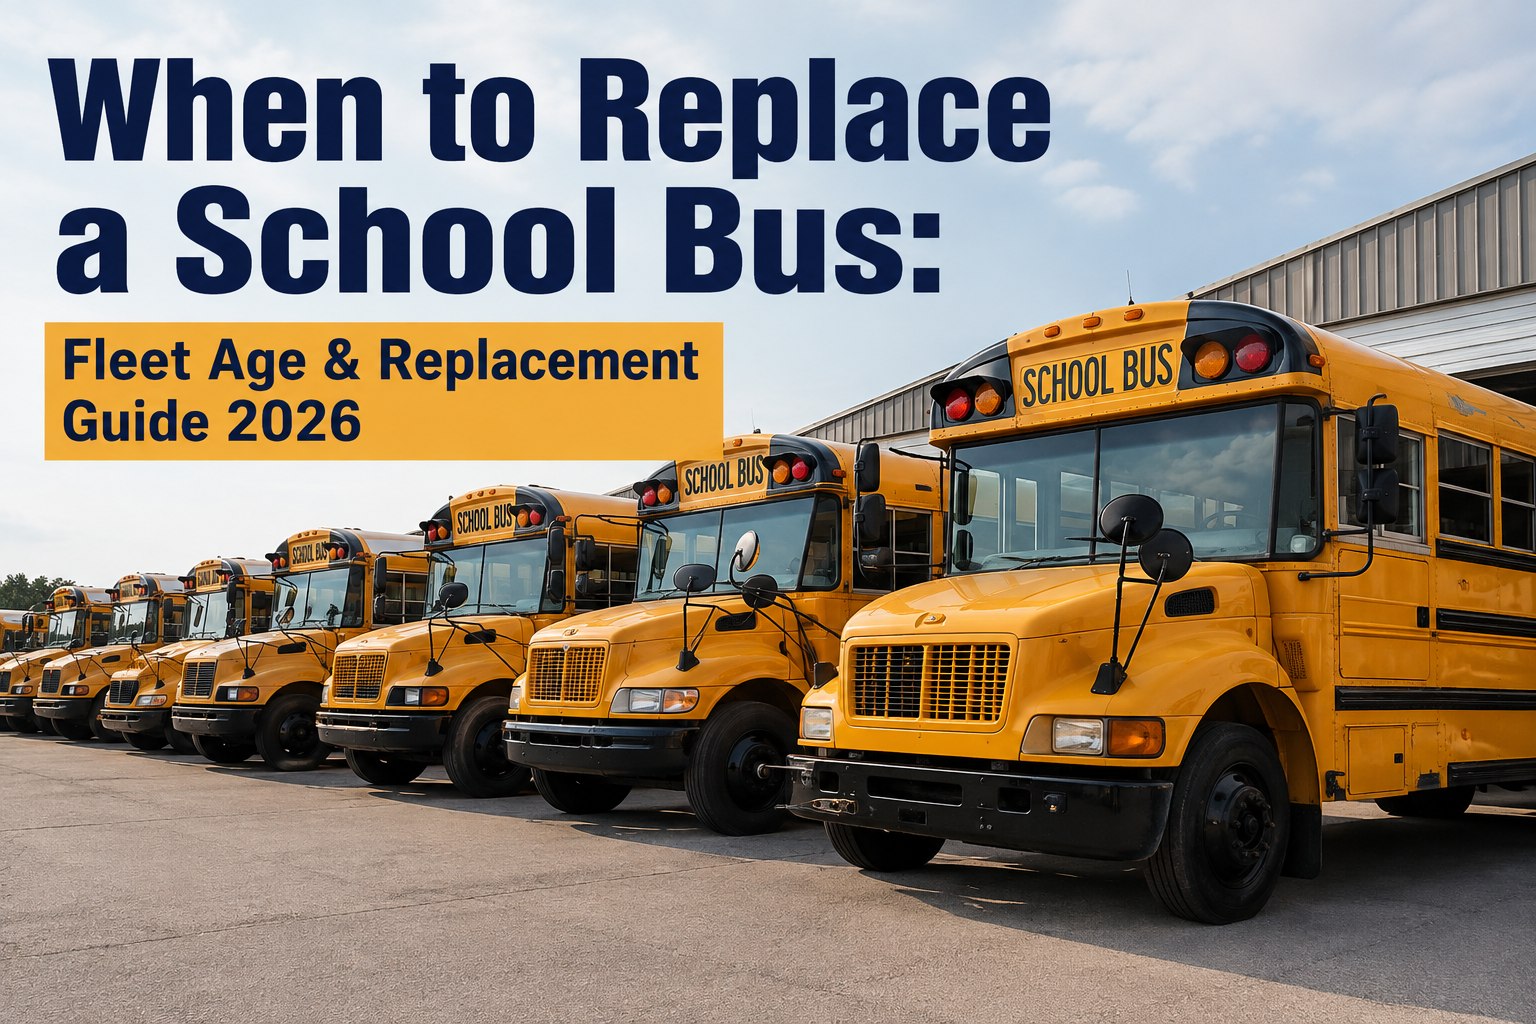
NHTSA guidance says 12-15 years or 150,000-200,000 miles. But that is a starting frame, not a rule. Some buses hit 14 years at $1.02 per mile in maintenance, well past the replacement break-even. Others hit 16 years at $0.62 per mile on short routes with disciplined PM and are still cheaper to keep than replace. New Type C diesel buses now cost $90,000-$130,000, wheelchair-accessible $183,000-$220,000, and electric $300,000-$400,000 (with EPA Clean School Bus grants covering up to $325,000 per bus). This is the 2026 decision framework -- 5 replacement signals, 6 quantitative triggers, cost-per-mile curve, and the repair-vs-replace math every transportation director should run before submitting the capital request. See BusCMMS surface replacement candidates from cost-per-mile drift → book a 20-min demo.
When to Replace a School Bus: 2026 Fleet Decision Guide
The 5 replacement signals, 6 quantitative triggers, cost-per-mile curve, and the 2026 pricing every transportation director needs before the next capital request.
Age & Mileage
12-15 years OR 150K-200K miles per NHTSA. First quantitative check.
Cost Per Mile
Annual maintenance CPM exceeds 125-150% of fleet baseline. The economic breakpoint.
Safety & Compliance
Recurring DOT inspection failures, missing modern safety features, emissions non-compliance.
Unscheduled Breakdowns
8+ unplanned breakdowns per year. Diesel fleet average is 4-6. Anything higher signals fatigue.
Repair-to-Value Ratio
Annual repair spend exceeds 50% of current residual value. Money going into a bus worth less than it costs.
The 6 Quantitative Replacement Triggers
Each trigger is measurable. Each has a defensible threshold. Two or more firing on one bus = replace this year.
Age-based replacement policy has always been the default -- retire buses at 12 years. But age alone is a blunt instrument. A short-route Type C in a mild climate can run 16 healthy years. A long-route bus in a mountain district can be economically dead at 9. The six triggers below give a data-driven replacement decision that a school board actually accepts. Every trigger is measurable in a modern CMMS. Every one has a threshold that FTA and industry averages support.
- 01
Cost-Per-Mile Above 125% of Fleet Baseline
ECONOMIC BREAKPOINTWhen one bus's maintenance CPM exceeds 125-150% of your fleet's average, the economic case for continued operation weakens rapidly. A fleet baseline of $0.85/mi means the trigger fires at $1.06/mi. Aging bus curves accelerate exponentially past this point.
- 02
Annual Repair Spend Above 50% of Residual Value
CRITICAL · REPAIR-TO-VALUE RULEA 12-year Type C worth $22K in the used market should not be receiving $12K in annual repairs. When yearly repair spend crosses 50% of current residual value, you are pouring money into an asset worth less than it costs to keep. Every additional year compounds the loss.
- 03
Unscheduled Breakdowns Above 8 Per Year
RELIABILITY THRESHOLDWell-managed diesel fleets average 4-6 unplanned breakdowns per bus per year. Anything at 8+ per year signals mechanical fatigue -- and each breakdown carries $3,500 in emergency labor, towing, substitute transport, and route disruption costs beyond the visible repair invoice.
- 04
DOT Inspection Failures Recurring
COMPLIANCE FATIGUEOne inspection failure is a maintenance issue. Three inspection failures in 18 months is structural. Systems are aging faster than PM can catch them. This is the safety signal every school board will support in the capital request.
- 05
Fuel Efficiency 15% Below Peer Buses
EFFICIENCY DECAYA bus running 15% below the MPG of matched peer units on similar routes indicates aggregate wear -- combustion efficiency, aftertreatment degradation, drivetrain drag, tire condition. Fuel is 53% of diesel TCO, so 15% MPG drop is real money over remaining service life.
- 06
Modern Safety Features Missing
STUDENT SAFETYPre-2007 emissions buses. Missing lap-shoulder belts. Older stop arms, crossing gates, LED lighting. When the district specifies these on new orders and this bus does not have them, replacement is not just economics -- it is a defensibility question at the next community meeting.
Two or more triggers firing on the same bus is the replacement candidate. All six firing is the emergency. See BusCMMS flag replacement candidates per bus based on these 6 triggers → book a demo.
The Maintenance Cost-Per-Mile Escalation Curve
What "aging exponentially" actually looks like across a 12-year school bus lifecycle.
Every experienced transportation director has seen the curve, but few have the number attached to each year. Diesel school bus maintenance cost-per-mile is nearly flat through year 5, doubles between years 6 and 9, and doubles again between years 10 and 12+. The four bands below are what the FTA National Transit Database and matched school district cost data actually show. The band where you sit determines whether the bus is a keeper or a candidate.
Warranty covers most major systems. PM is on schedule. Repairs are minor and routine. Keep and run.
First major services surface (injectors, batteries, tires, brake components). Still economically strong. Discipline PM to hold this band.
Aftertreatment repairs, transmission service, cooling system, unscheduled breakdowns rising. Watch closely. Cost-per-mile drift begins.
Structural repairs, engine + transmission rebuilds, brake corrosion, frame fatigue. Repair costs compound each year. Replacement candidate.
Cost doubles roughly every 5 years across the lifecycle. A bus at $0.55/mi in year 7 will most likely be at $1.00+/mi by year 12. Discipline PM to stay in the lower band longer, but do not expect to escape the curve.
Per-bus curves show which units are ahead of the industry average and which are already past. That is where the replacement list writes itself. See BusCMMS plot each bus's CPM curve against the fleet baseline → book a demo.
2026 Replacement Cost Reference
Know the check you are writing before the trade-in question comes up.
School bus prices have climbed 40-60% since 2020. The 2026 pricing below is the working range for capital requests going into the next budget cycle, sourced from BusesForSale.com pricing data, EPA Clean School Bus Program guidance, and current bid-contract references. Wheelchair-accessible units carry a $50K-$100K premium. Electric buses cost 2.5x-3x diesel on paper, but EPA CSB grants can offset $170K-$325K per unit for priority districts.
For non-grant districts, diesel Type C remains the default. For grant-eligible districts, the electric TCO gap closes to zero at year 5-6 and diesel loses from there. See BusCMMS surface replacement candidates with TCO projections → book a demo.
3 Real Fleet Scenarios: Which Path Does Each Bus Take?
Same 12-year-old Type C. Three completely different replacement calls based on the numbers.
Age alone is misleading. Three real-world scenarios below show what actually drives the decision. Same platform, same age, same fleet -- three different answers based on the data attached to each bus.
Bus #17 — The Long-Life Winner
Decision: Keep 2-3 more years. Continue disciplined PM. Below fleet baseline on cost, no reliability signals, no safety flags. Bus is telling you it wants to run.
Bus #24 — The Borderline Case
Decision: Reassign to shortest available route next year. If CPM crosses $1.06 (125% baseline), replace at year 13. Not urgent yet, but on the watchlist.
Bus #31 — The Clear Retirement
Decision: Replace this fiscal year. Repair spend crossed 50% of residual value, CPM well above breakpoint, breakdowns almost double fleet average. Every additional month is money out the door.
The 3 buses left the assembly line the same year. The data attached to each one now writes the capital request. Sign up free and score your fleet on the same 6 triggers →
Where BusCMMS Fits Your Replacement Planning
Six ways the replacement decision becomes data-driven instead of gut-feel.
Cost-Per-Mile Per Bus, Refreshed Monthly
Every bus's CPM tracked and compared against fleet baseline. Automatic flag when any bus crosses 125% of fleet average.
Repair-to-Value Ratio Alerts
Every repair invoice compared to current residual value. Alert when annual repair spend crosses 50% of what the bus is worth.
Unscheduled Breakdown Counter
Every road call, tow, and unplanned service logged per bus. Fleet average calculated automatically. Outlier buses surface.
DOT Inspection History Per Bus
Every inspection pass, defect, and re-inspection tracked per bus. Recurring pattern surfaces as compliance-fatigue flag.
MPG Trend Vs Peer Buses
Fuel data auto-imported. Same-route peer buses grouped. Any bus 15%+ below peer group flags for efficiency decay review.
Board-Ready Capital Request Reports
Every replacement candidate's 6-trigger score exported in one click. Data package the school board can defend to the community.
Our replacement policy was age-based -- 12 years, retire, next bus in the queue. School board loved the simplicity. Nobody loved what it cost us. When we moved to trigger-based scoring in BusCMMS, we found 6 buses at 12-14 years that were cheaper to keep than replace and 3 buses at 9-10 years that were bleeding money the age-based policy would never have caught. Rebalanced the capital request. Kept 6 buses another 2 years, retired 3 buses early, saved $412,000 in unnecessary purchases and $89,000 in avoided repairs across one fiscal cycle. The school board approved the same year's capital request in one meeting because every replacement had a defensible score attached to it.
$412K in avoided unnecessary purchases. $89K in avoided repairs. One fiscal year. Run the same scoring on your fleet →
Frequently Asked Questions
When should a school bus be replaced?
NHTSA school bus service life guidance points to 12-15 years OR 150,000-200,000 miles as the standard replacement window, but age and mileage alone are blunt instruments. A short-route Type C in a mild climate with disciplined preventive maintenance can run economically to 16 years. A long-haul mountain-district bus can be economically dead at 9 years. The better approach is a 6-trigger scoring model where age is one input alongside cost-per-mile compared to fleet baseline (fires at 125% of average), annual repair spend as a percentage of residual value (fires above 50%), unscheduled breakdowns per year (fires above 8, versus fleet average of 4-6), DOT inspection failure frequency (fires at 3+ in 18 months), fuel efficiency versus peer buses on similar routes (fires at 15% below peers), and missing modern safety features (pre-2007 emissions, missing lap-shoulder belts, older stop arms). Two or more triggers firing on the same bus is a candidate for replacement this fiscal cycle. All six firing is an emergency replacement.
How much does a new school bus cost in 2026?
Prices have climbed 40-60% since 2020. As of 2026, Type A mini buses (12-30 passenger) run $40,000-$75,000 diesel or gas. Type C conventional buses (72-90 passenger, the most common school bus configuration) run $90,000-$130,000 diesel. Type D transit-style buses (78-90 passenger) run $120,000-$160,000. Wheelchair-accessible buses with lifts and adaptive equipment run $183,000-$220,000 -- a $50,000-$100,000 premium over the base platform. Electric school buses list at $300,000-$400,000, but the EPA Clean School Bus Program can offset $170,000-$325,000 per bus for priority districts, bringing net cost after grant to $75,000-$230,000 -- competitive with or below diesel for grant-eligible operations. Used bus market pricing: 10-12 year old Type C with 100,000-150,000 miles sits in the best value window at $15,000-$30,000. Under-5-year-old used buses run $60,000-$90,000. Type A used buses trade at 30-40% below comparable Type C pricing across all age bands.
What is the maintenance cost-per-mile curve for a school bus?
Diesel school bus maintenance cost-per-mile roughly doubles every 5 years across the lifecycle. Years 1-5 typically run around $0.35 per mile -- most systems are under warranty, PM is easy, repairs are minor. Years 6-8 escalate to around $0.55 per mile as first major services surface (injectors, battery replacements, tires, brake component overhauls). Years 9-11 climb to around $0.75 per mile with aftertreatment repairs, transmission service, cooling system work, and unscheduled breakdowns rising. Years 12+ typically hit $1.00 per mile or higher with structural repairs, engine and transmission rebuilds, brake corrosion, and frame fatigue -- this is the replace zone. Well-managed diesel fleets running disciplined preventive maintenance can hold the lower band longer, but no PM program escapes the curve entirely. Electric buses show a very different curve -- APTA's 2024 Public Transportation Vehicle Database reports transit buses over 10 years old at $0.58/mile for diesel versus $0.29/mile for electric. The FTA National Transit Database also shows fleets implementing CMMS achieve 15-22% reductions in unplanned maintenance costs within 18 months, which flattens the curve meaningfully in the middle bands where PM discipline matters most.
How do you calculate the repair-vs-replace decision on a school bus?
The core calculation is the repair-to-value ratio. Take annual repair spend for the bus in question (last 12 months of parts + labor, excluding routine PM). Divide by the bus's current residual value (used market price for the same platform, age, and mileage -- sources include BusesForSale.com listing data or district surplus auction comparables). If the ratio exceeds 50%, replacement math wins over continued repair -- you are pouring money into an asset worth less than it will cost to keep operational. Example: a 12-year Type C worth $22,000 in the used market that is receiving $12,000 in annual repairs is 55% repair-to-value and should be replaced. Layer this with the cost-per-mile trigger (bus's CPM versus fleet baseline of 125%), the breakdown frequency (versus fleet average of 4-6 per year), and remaining useful life projections. The 6-trigger scoring model at the top of this guide is the practical application. Any bus scoring 2+ triggers is on the replacement list. Buses scoring 4+ triggers are the priority for the current fiscal year's capital request.
How does BusCMMS help decide when to replace a school bus?
BusCMMS tracks cost-per-mile per bus, refreshed monthly, and compares each bus against the fleet baseline automatically -- flagging any bus that crosses 125% of the fleet average as a replacement candidate. Every repair invoice is compared to the current residual value for that platform/age/mileage, and an alert fires when annual repair spend crosses 50% of what the bus is worth in the used market. Every road call, tow, and unplanned service is logged per bus, with fleet averages calculated automatically so outlier buses running 8+ breakdowns per year surface for review. DOT inspection history is tracked per bus with every pass, defect, and re-inspection, and recurring patterns generate a compliance-fatigue flag. Fuel data imports automatically from fuel cards or telematics, matched-route peer buses are grouped, and any bus running 15%+ below peer group MPG surfaces for efficiency decay review. When it comes time to submit the capital request, every replacement candidate's 6-trigger score exports in one click as a board-ready data package -- exactly the defensible documentation that gets requests approved in one meeting rather than sent back for more analysis. One 74-bus Mid-Atlantic K-12 district reported saving $412,000 in unnecessary bus purchases and $89,000 in avoided repairs during their first fiscal cycle after moving from age-based to trigger-based replacement scoring in BusCMMS -- keeping 6 buses that were cheaper to run than replace and retiring 3 buses at 9-10 years that were bleeding money the age-only policy would never have caught.