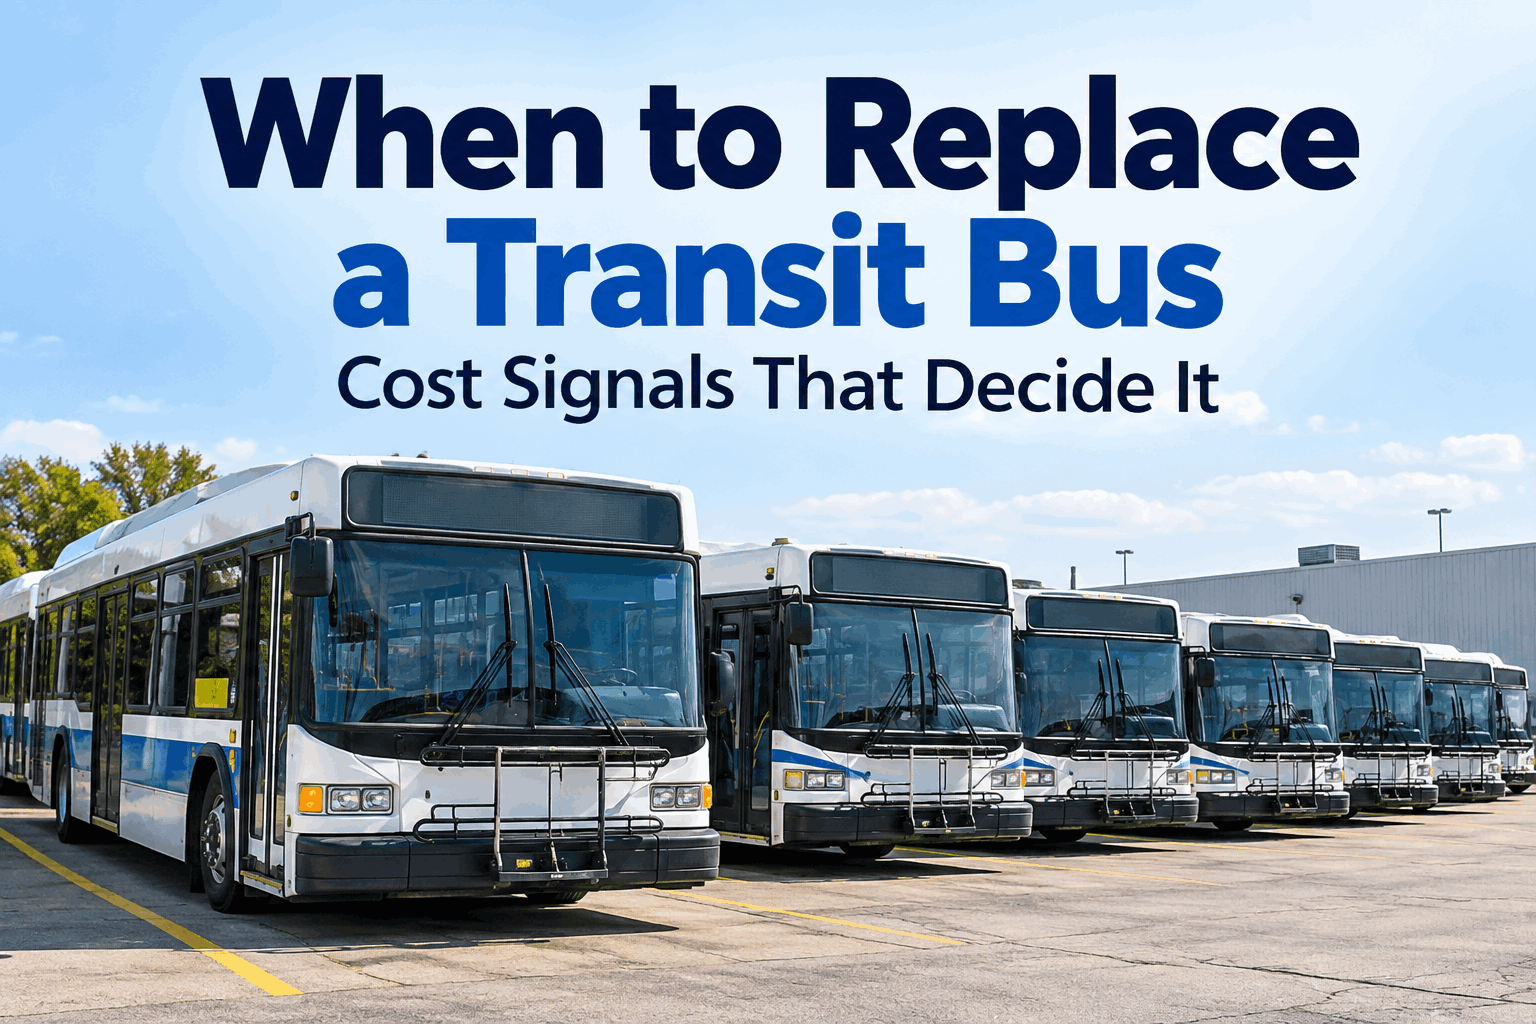
Every aging bus reaches a point where fixing it costs more than the service it still delivers, and almost nobody marks the day it happens. This guide shows the cost signals that reveal that turning point, so you replace on evidence instead of age or guilt.
Why Age Alone Is the Wrong Trigger
The FTA Useful Life Benchmark, roughly 12 to 14 years or 500,000 miles for a heavy-duty transit bus, is the right starting line for capital planning and grant eligibility. It is a poor finish line. Two buses can reach the same birthday in completely different condition, and a calendar cannot tell you which one is quietly draining your operating budget.
A birthday-based rule would retire Bus 118 first and keep funding Bus 204. Sign up to see every bus's cost per mile against its class average and let the data pick the order.
The Five Signals a Bus Has Crossed the Line
Think of these as a scorecard. When a bus trips two or more, it deserves a formal replacement review before the next major repair gets approved.
Scoring five signals across a whole fleet by hand is where most replacement reviews stall. Book a demo to see these signals scored automatically for every bus you run.
Repair, Rebuild, or Replace: Price All Three
Replacement is not the only alternative to another repair. A mid-life rebuild can buy years on a bus whose chassis and drivetrain are still sound, so the honest comparison has three columns, not two.
Whichever option wins, the decision is only as strong as the repair history behind it. Book a demo to see how your repair history becomes a replacement case your finance team can approve.
Run the Replacement Math in Four Steps
Done by hand, this takes weeks of spreadsheet work every budget cycle. Sign up and start building per-bus cost history today so the first three steps are already finished when you need them.
Expert Review: One Bus, One Decision, Zero Guesswork
Here is what a data-backed replacement brief looks like for a single bus, the kind of page a finance committee can approve in minutes instead of debating for months.
Conclusion: Let the Cost Curve Make the Call
The right time to replace a transit bus is not a birthday, a mileage figure, or the moment someone loses patience. It is when repair cost, downtime, and remaining value say the bus has crossed its line, and you can prove it. Book a demo with the BusCMMS team to see that proof built from your own fleet data.
Frequently Asked Questions
When should a transit bus be replaced?
When its own cost data says so. Common triggers are cost per mile more than 10% above its class average, a single repair above 50% of its value, trailing 12-month repair cost above 150% of the class average, and rising downtime. A bus that trips two or more deserves a formal replacement review.
What is the FTA Useful Life Benchmark, and does reaching it mean replace?
For a heavy-duty transit bus the benchmark is roughly 12 to 14 years or about 500,000 miles. It guides capital planning and state-of-good-repair reporting, but it is not a per-bus replacement order. Local agencies decide the actual timing based on condition and cost.
What is the sunk cost trap in fleet replacement?
It is the habit of approving another repair because so much has already been spent on the bus. Past spending is gone either way, so only the next dollar matters: will it deliver more value on this bus than it would toward a replacement?
Is it ever cheaper to rebuild a bus than replace it?
Often, when the chassis and drivetrain are sound. Refurbishment is commonly reported at $150,000 to $250,000 versus $600,000 or more for a new bus, adding several years of service. If repair history keeps climbing despite a rebuild, replacement usually wins.
What data do I need for a replacement case, and how does BusCMMS help?
You need per-bus maintenance cost, downtime, mileage, and repair history, compared against class averages. BusCMMS keeps that history in one system and turns it into analytics and reports, so the case is built from records instead of memory.