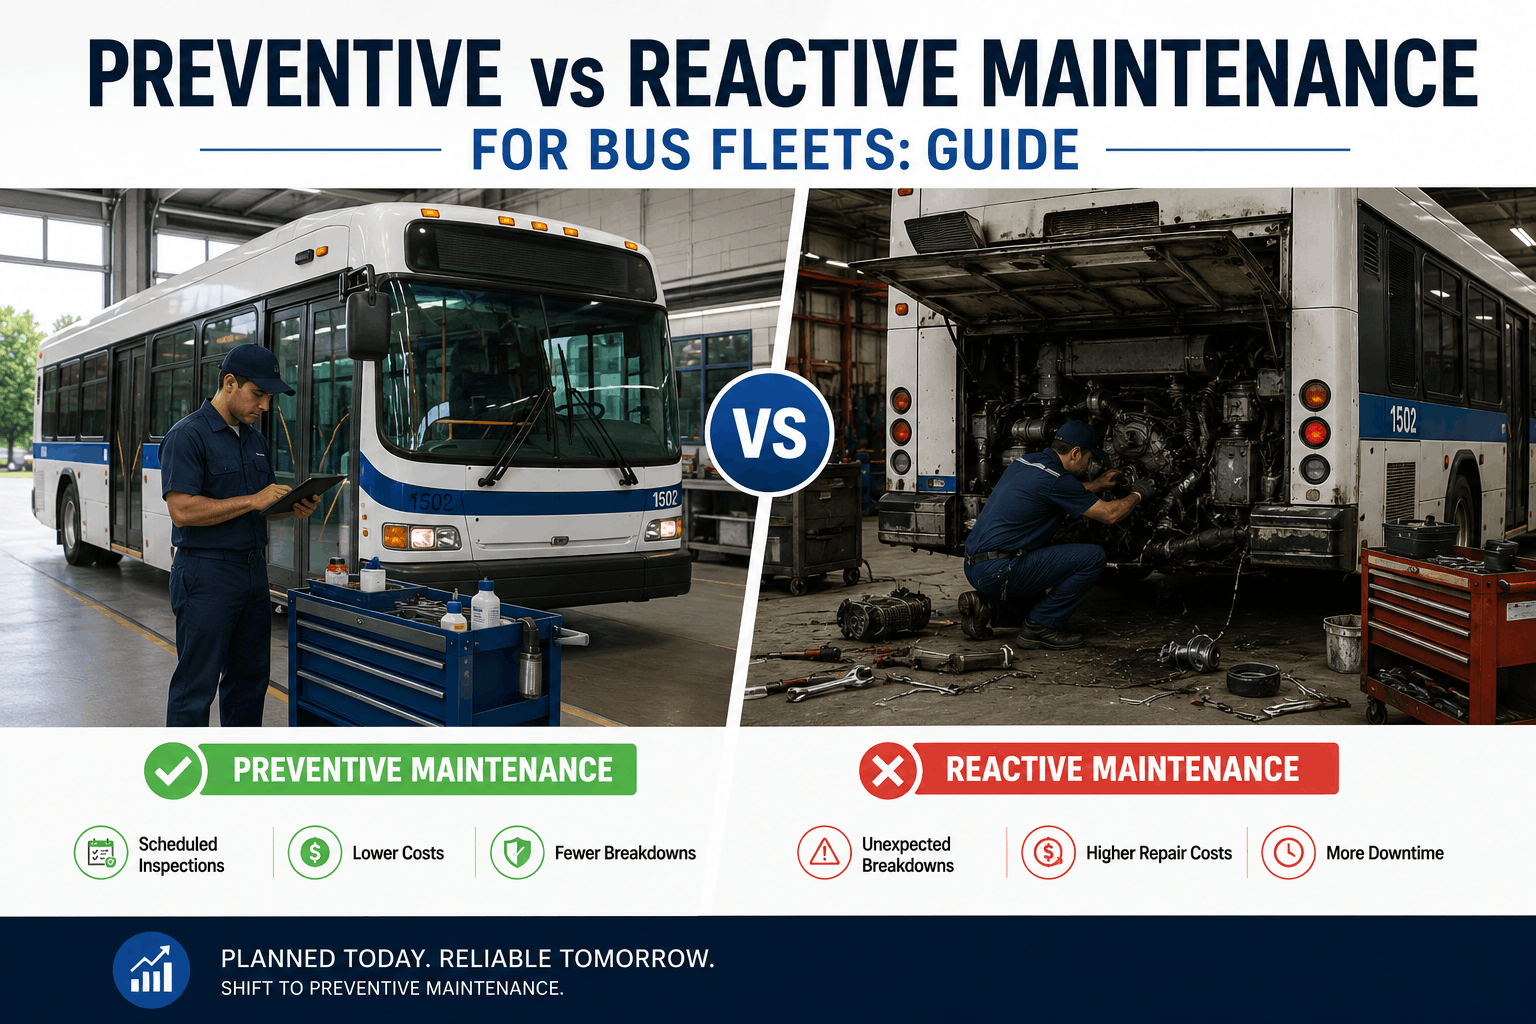
Preventive vs Reactive Maintenance for Bus Fleets: Guide
Every bus fleet maintenance department faces the same fundamental decision: fix problems before they happen or repair breakdowns after they occur. The financial difference between these two approaches is staggering. Reactive maintenance, where buses are repaired only after they break down on the road, costs American transit agencies three to four times more than planned preventive maintenance. A single roadside breakdown can cost $1,500 to $3,000 in towing, emergency labor, and missed route penalties. Multiply that across a 100-bus fleet experiencing just two breakdowns per bus annually, and reactive maintenance costs can exceed $500,000 per year. This comprehensive guide compares preventive and reactive maintenance strategies for American bus fleets, quantifies the true cost of breakdown repairs, and provides a practical roadmap for shifting your maintenance balance toward planned, proactive service. Learn how to reduce emergency repairs by 70 percent, extend component life by 50 percent, and build a maintenance program that keeps your buses on the road and your budget under control.
Maintenance Strategy 2026
Preventive vs Reactive Maintenance for Bus Fleets: Complete Guide
Reactive repairs cost 3 to 4 times more than planned ones. Compare preventive and reactive maintenance for bus fleets and learn how to shift the balance across American transit operations.
Before comparing costs and outcomes, it is essential to understand the fundamental differences between preventive and reactive maintenance approaches for American bus fleets. Each strategy has its place, but successful fleet operations deliberately shift the balance toward planned work.
3x to 4xHigher Reactive Cost
70%Fewer Breakdowns with PM
50%Longer Component Life
Strategy
Reactive Maintenance
Preventive Maintenance
Trigger
Component failure or breakdown
Time interval or mileage target
Timing
Unplanned, urgent, disruptive
Scheduled, predictable, controlled
Labor Cost
Overtime, emergency call-out rates
Regular hourly rates, planned shifts
Parts Cost
Emergency freight, premium pricing
Bulk pricing, standard shipping
Downtime Impact
Extended, unpredictable, service disruption
Minimal, scheduled during off-hours
Safety Risk
Higher, failures often occur in service
Lower, issues caught before failure
The True Cost of Reactive Maintenance
When a bus breaks down on the road, the visible costs like towing and emergency labor are just the beginning. Hidden costs multiply the financial impact dramatically for American transit agencies. Understanding these full costs makes the business case for preventive maintenance impossible to ignore.
Emergency Towing and Recovery$500 to $1,500
After-Hours Technician Overtime$300 to $800
Expedited Parts Shipping$150 to $500
Missed Route Penalties$500 to $2,000 per day
Passenger Alternative Transport$200 to $800
Secondary Damage from Failure$1,000 to $10,000
Total Average Breakdown Cost$2,500 to $15,000
Annual Cost Comparison: 100-Bus Fleet
The financial difference between reactive and preventive maintenance becomes clear when projecting annual costs for a typical American bus fleet. This comparison assumes a 100-bus operation with average usage patterns.
Reactive Maintenance Fleet
$380,000 to $750,000
Assumes 2 to 3 breakdowns per bus annually, emergency labor rates, expedited parts, and missed route penalties for American transit agencies
Preventive Maintenance Fleet
$120,000 to $200,000
Assumes scheduled PM labor at regular rates, bulk parts pricing, minimal breakdowns, and planned downtime coordination
Annual Savings with PM
$260,000 to $550,000
Enough to fund additional maintenance staff, shop equipment, or bus replacements for American fleets
Benefits of a Preventive Maintenance Program
Shifting from reactive to preventive maintenance delivers benefits that extend far beyond direct cost savings for American transit agencies. These operational improvements create a virtuous cycle of higher availability, lower costs, and better safety outcomes.
Benefit 1: Extended Component Life
Regular oil changes, filter replacements, and lubrication extend engine life by 50 percent and transmission life by 40 percent for American bus fleets.
Benefit 2: Reduced Roadside Breakdowns
Fleets with robust PM programs experience 70 to 80 percent fewer roadside breakdowns compared to reactive-dependent operations across the United States.
Benefit 3: Lower Total Cost of Ownership
Well-maintained buses retain higher resale value and require fewer major repairs, reducing lifetime ownership costs by 25 to 35 percent for American transit.
Benefit 4: Improved Safety Compliance
Preventive maintenance ensures brakes, tires, lights, and emergency systems are always within FMCSA and DOT specifications for US fleets.
Benefit 5: Predictable Labor Scheduling
Planned PM work allows shops to balance workload across shifts, eliminate emergency overtime, and improve technician morale for American operations.
Benefit 6: Higher Fleet Availability
Preventive maintenance keeps more buses on the road every day, reducing the spare ratio needed from 20 percent to 10 percent for US transit agencies.
Building Your Preventive Maintenance Schedule
An effective PM schedule balances service frequency against operational disruption. These industry-standard intervals for American bus fleets provide a starting point for your preventive maintenance program.
Daily Inspections
Pre-Trip and Post-Trip Driver Checks
Lights, tires, fluid levels, mirrors, windshield, wipers, horn, and seat belts. Documented via DVIR for American compliance.
Every 5,000 Miles
Light Maintenance Service
Oil and filter change, chassis lubrication, brake inspection, tire rotation, and fluid top-off for US bus fleets.
Every 15,000 Miles
Intermediate Service
Air filter replacement, fuel filter change, transmission fluid check, cooling system inspection, and belt tension verification.
Every 30,000 Miles
Major Service
Full fluid changes including transmission and differential, valve adjustment, chassis torque check, and component wear measurement.
Every 12 Months
Annual DOT Inspection
Comprehensive safety inspection covering all FMCSA-required systems for legal operation of American buses.
Shifting from Reactive to Preventive: Implementation Roadmap
Moving a fleet from reactive to preventive maintenance does not happen overnight. This phased approach helps American transit agencies transition smoothly without disrupting daily operations.
1
Audit Current Maintenance PatternsReview the past 12 months of repair data. Calculate what percentage of work was reactive versus planned for your American fleet operation.
2
Define PM Intervals by Asset TypeEstablish mileage and time-based intervals for each bus model in your fleet based on manufacturer recommendations for US operations.
3
Deploy CMMS for PM SchedulingImplement BusCMMS to automate PM work order generation, track completion, and alert managers to overdue services for American fleets.
4
Train Staff on New ProcessesEducate drivers on defect reporting and technicians on PM inspection checklists and documentation for US transit compliance.
5
Monitor and Adjust ContinuouslyTrack PM compliance, breakdown frequency, and cost trends. Adjust intervals based on actual component wear patterns.
When I took over fleet maintenance for a 200-bus transit agency in Ohio, we were operating in full reactive mode. Our breakdown rate was 22 incidents per month, and our maintenance budget was completely out of control. We implemented BusCMMS preventive maintenance scheduling and gradually shifted our culture from fix-it-when-it-breaks to proactive service. Within 12 months, our monthly breakdowns dropped to just 4 incidents. Annual maintenance costs decreased by 38 percent. The most rewarding change was seeing our technicians take pride in preventing failures rather than just repairing them. Every American fleet manager should make preventive maintenance their top priority.
Thomas R., Fleet Maintenance Director, Ohio Transit Agency
Frequently Asked Questions About Preventive vs Reactive Maintenance
What percentage of maintenance should be preventive versus reactive?
Best-in-class American bus fleets achieve 80 to 90 percent preventive maintenance, with only 10 to 20 percent reactive work for unexpected failures.
Can a fleet operate with zero reactive maintenance?
No, some reactive maintenance is unavoidable due to random component failures, but American fleets can reduce reactive work below 15 percent with good PM.
How often should preventive maintenance intervals be reviewed?
American fleets should review PM intervals annually or whenever failure patterns change, adjusting based on actual component wear data.
Does preventive maintenance really save money on older buses?
Yes, preventive maintenance delivers even higher ROI on older American buses by preventing catastrophic failures that would total the vehicle.
How do I convince leadership to invest in preventive maintenance?
Present the cost comparison of reactive versus preventive maintenance for your American fleet, showing projected annual savings of $260,000 to $550,000.
What is the ideal PM compliance rate for bus fleets?
American transit agencies should target 95 percent or higher PM compliance, meaning services are completed within 10 percent of scheduled intervals.
How does preventive maintenance affect bus resale value?
Well-documented preventive maintenance history increases resale value by 15 to 25 percent for American buses compared to vehicles with spotty records.
What is the difference between preventive and predictive maintenance?
Preventive maintenance follows fixed schedules while predictive uses sensors and AI to predict failures, but both are proactive strategies for American fleets.
Shift Your Fleet from Reactive to Preventive Today
Reduce breakdowns by 70 percent, cut maintenance costs by 30 percent, and extend bus life by 50 percent. Join 500+ American transit agencies using BusCMMS for preventive maintenance.