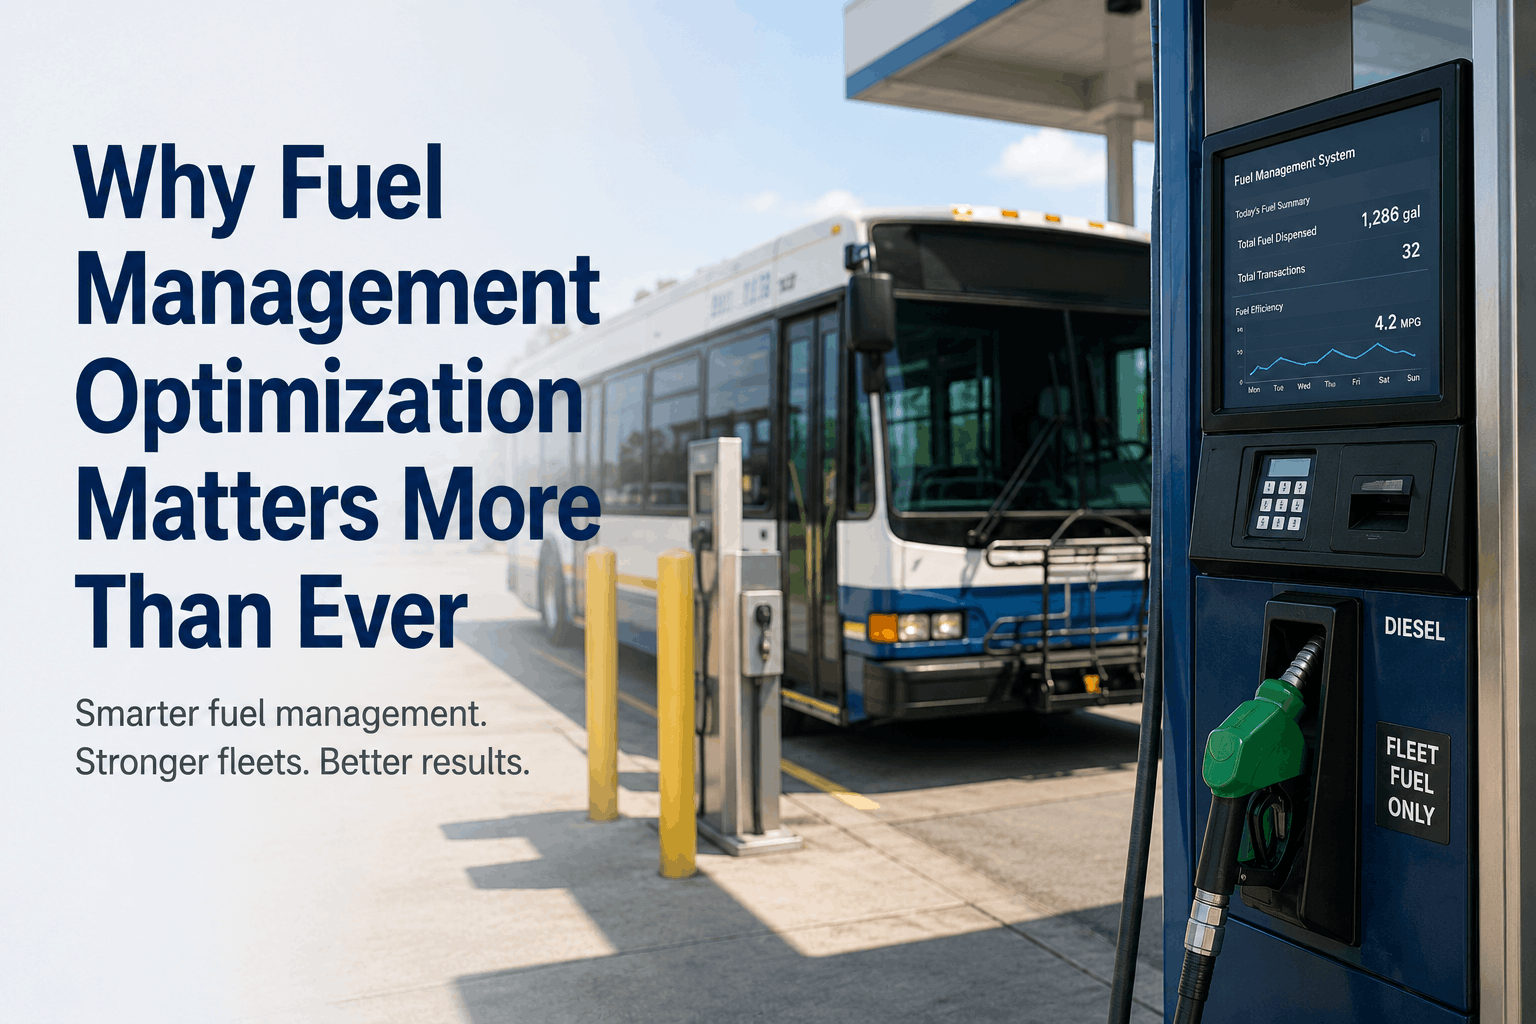
Fuel is the single largest variable operating expense for American school bus fleets and public transit agencies—often exceeding labor costs and second only to vehicle depreciation. For a 100-bus school district operating on a typical annual mileage of 15,000–25,000 miles per bus, total annual fuel spend ranges from $1.2 million to $2.5 million depending on diesel prices, route efficiency, and driver behavior. In 2026, with diesel fluctuating between $3.50 and $5.00 per gallon across the United States and electric bus adoption introducing new energy cost tracking requirements, fuel management optimization has become a strategic priority. The average school bus achieves 5.5 to 7.5 miles per gallon; transit buses in stop-and-go service average 3 to 5 MPG. A modest 10% improvement in fleet-wide fuel economy translates to $120,000–$250,000 annual savings for large districts. The challenge: identifying fuel waste hidden in daily operations requires real-time visibility into consumption patterns, driver behavior, and vehicle condition metrics that traditional maintenance systems do not track. Modern fuel management solutions combine maintenance data (engine condition affecting efficiency), telematics data (idle time, hard acceleration, speed patterns), and route data (stop-and-go efficiency, idle waiting) into unified dashboards that pinpoint exactly where fuel is being wasted and where intervention delivers the highest return.
Optimize Fuel Costs Across Diesel, Propane, and Electric Fleets
BusCMMS integrates maintenance data with telematics analytics to identify fuel waste patterns—helping school districts and transit agencies reduce fuel consumption by 10–15% through data-driven driver coaching, idle reduction, and predictive maintenance.
Understanding Fleet Fuel Consumption: Where Waste Hides
Fuel waste in school bus and transit operations happens at four distinct points in daily operations, each representing an opportunity for optimization. Most districts do not realize they have a fuel problem until year-end reconciliation reveals budget overruns. By then, opportunities to recover hundreds of thousands of dollars have passed. The solution is real-time visibility into fuel consumption patterns so fleet managers can intervene mid-year rather than analyzing problems after they have consumed the budget.
Waste Point 1: Excessive Engine Idling
A school bus or transit bus burns 0.5 to 1.0 gallons per hour while idling—consuming $2 to $5 hourly depending on diesel price. Idling happens while waiting for students to board, between route connections, during morning layovers, and while drivers wait for replacement transportation. For a 50-bus fleet averaging just 15 minutes of idle time per bus daily, that's 750 hours monthly of pure waste: approximately 625 gallons burned at idle with zero miles traveled. Annual idle waste for this single fleet: $12,500–$25,000 in wasted fuel. Telematics integration with BusCMMS identifies idle time patterns, flags buses exceeding idle thresholds, and enables driver coaching on engine shutdown discipline.
Waste Point 2: Driver Behavior and Aggressive Acceleration
Hard acceleration from stops increases fuel consumption by 20–40% compared to gradual acceleration. Harsh braking requires subsequent acceleration that burns additional fuel. Excessive speed (above 60 MPH) reduces highway efficiency by 7–10% per 5 MPH increment. The difference between the most efficient and least efficient driver in the same bus on the same route can be 20–30% in fuel consumption. Telematics platforms like Samsara and Geotab capture acceleration, braking, and speed patterns; BusCMMS integrates this data with maintenance records to identify which drivers need coaching and which buses have mechanical issues affecting efficiency. Eco-driving training programs improve fuel economy by 10–15% sustained when combined with real-time driver feedback.
Waste Point 3: Deferred Maintenance Reducing Engine Efficiency
Engine timing issues, clogged fuel injectors, worn transmission seals, misaligned axles, and underinflated tires all increase fuel consumption. A bus running with a partially clogged air filter loses 2–3% fuel efficiency. A bus with misaligned axles or underinflated tires can lose 5–8% efficiency. Deferred engine work compounds these losses exponentially. BusCMMS tracks fuel consumption per bus month-to-month, automatically flagging upward cost-per-mile trends that indicate mechanical problems before they become safety issues. Early intervention—replacing fuel injectors, realigning axles, correcting tire pressure—restores fuel economy to baseline and prevents emergency repairs that cost 5–10× more than preventive maintenance.
Waste Point 4: Route Inefficiency and Unnecessary Mileage
Inefficient route planning—excessive left turns, backtracking, stops at multiple transfer points, redundant stop sequences—adds miles that directly increase fuel consumption. A 2-mile route variance per bus daily equals 40+ miles annually per bus, consuming 5–8 additional gallons annually per vehicle. Route optimization software combined with BusCMMS fuel analytics identifies routes with fuel efficiency below baseline, enabling operations teams to consolidate stops, eliminate backtracking, and reduce stop-and-go inefficiency. Advanced route optimization reduces mileage by 5–10% without reducing service coverage.
Fuel Management Analytics: 5 Metrics That Drive Optimization
Effective fuel management requires tracking five core metrics that reveal consumption patterns and identify optimization opportunities. Bus fleet fuel analytics dashboards integrate these metrics into actionable intelligence for drivers, supervisors, and fleet directors.
Miles Per Gallon (MPG) by Bus and Driver
Track real-time MPG for each bus, identifying which vehicles are trending below baseline and which drivers consistently achieve highest efficiency. A diesel school bus baseline is 5.5–7.5 MPG; a transit bus baseline is 3–5 MPG. When a specific bus drops to 4.8 MPG (diesel) or 2.2 MPG (transit), mechanical issues are indicated and warrant investigation. When a driver's MPG consistently trails fleet average, driver coaching interventions address behavior patterns.
Fuel Cost Per Mile Trending
Cost per mile combines fuel consumption with fuel price, providing the metric fleet managers use for budget planning and efficiency measurement. A diesel fleet baseline is $0.65–$0.85 per mile; a transit fleet is $0.95–$1.35 per mile depending on service type. Electric fleets average $0.18–$0.35 per mile. Monthly trending reveals whether improvement efforts are working or whether hidden inefficiencies are driving costs upward. BusCMMS calculates cost per mile automatically, enabling monthly trending reports that identify problem areas before year-end reconciliation.
Idle Time Percentage and Idle Fuel Waste
Idle time as percentage of total operating time reveals opportunities for idle reduction. Industry best practice is under 5% idle time (for unavoidable waiting). When idle time exceeds 8–10%, driver behavior or operational procedures are wasting fuel. Telematics integration calculates idle percentage; BusCMMS flags buses and routes with excessive idle patterns. A route redesign that eliminates idle bottlenecks can save 8–12% total fuel consumption on that route.
Energy Consumption for Electric and Hybrid Fleets
Electric buses measure efficiency in kilowatt-hours per mile (kWh/mi); hybrids track both fuel consumption and electric assist. A properly maintained electric school bus consumes approximately 1.8–2.5 kWh per mile; efficient operation can reduce this to 1.6–2.0 kWh/mi. BusCMMS integrates with charging systems and telematics to track kWh consumption by bus, identifying mechanical issues or charging inefficiencies that waste energy. Cost per mile for electric buses ($0.18–$0.35) remains 60–75% lower than diesel despite slightly higher mechanical attention.
Preventive Maintenance Impact on Fuel Efficiency
Tracking fuel efficiency before and after major maintenance (transmission service, engine tuning, axle alignment, tire replacement) quantifies the impact of preventive maintenance on operational costs. A fuel injection service that costs $450 might improve fuel economy by 3–5%, saving 120–200 gallons annually—recovering the service cost in 6–12 months. BusCMMS calculates this ROI automatically, helping fleet managers justify preventive maintenance spending to boards by demonstrating fuel savings impact.
Fuel Optimization Strategies: Implementation Framework with Measurable Targets
| Optimization Strategy | Implementation Complexity | Typical Savings Year 1 | Timeline to ROI |
|---|---|---|---|
| Idle Reduction Program with Driver Coaching | Low (telematics + training) | 5–8% fuel consumption reduction | 3–6 months with sustained driver engagement |
| Eco-Driving Training and Real-Time Feedback | Low (driver coaching, minimal tech) | 10–15% fuel economy improvement sustained | 4–8 weeks with driver participation; ongoing with reinforcement |
| Preventive Tire Pressure Maintenance | Low (weekly pressure checks, automated alerts) | 2–4% fuel efficiency gain | Immediate; costs minimal, savings consistent monthly |
| Predictive Maintenance for Engine Efficiency | Medium (fuel trend monitoring, diagnostic testing) | 3–6% restoration of degraded efficiency | 6–12 months to full impact as deferred maintenance cleared |
| Route Optimization and Stop Sequence Consolidation | Medium (route redesign planning, school calendar coordination) | 5–10% mileage reduction per route optimized | 3–6 months implementation; year 1 savings $80,000–$200,000 for 100-bus fleet |
| Electric Bus Fleet Transition (Long-term) | High (capital investment, charging infrastructure, driver training) | 60–75% fuel cost reduction vs. diesel; higher electricity cost still net-positive | 12-year bus lifespan; TCO typically lower than diesel within 8–10 years due to fuel + maintenance savings |
Frequently Asked Questions: Fleet Fuel Management Optimization
What is a realistic fuel economy improvement for school bus fleets implementing optimization?
Most districts combining idle reduction, driver coaching, and preventive maintenance achieve 10–15% fuel economy improvement within 12 months. Sustained improvements require ongoing driver feedback and maintenance discipline.
How much does excessive idling cost a 50-bus fleet annually?
With 15 minutes average daily idle per bus, a 50-bus fleet wastes approximately $12,500–$25,000 annually in idle fuel alone. Idle reduction is the single fastest payback fuel optimization intervention.
What is the fuel cost difference between diesel and electric school buses in 2026?
Diesel averages $0.65–$0.85 per mile in fuel costs; electric averages $0.18–$0.35 per mile. Even accounting for battery replacement and higher maintenance attention, electric buses save 60–75% in energy costs over their 12–15 year lifespan.
How does deferred maintenance affect fuel consumption for school buses?
A bus operating with deferred engine maintenance can lose 5–15% fuel efficiency depending on the issue. A clogged fuel injector costs 2–3% efficiency; engine timing problems cost 5–8% efficiency; deferred transmission service can cost 8–12%. Preventive maintenance that costs $500 often recovers through fuel savings within 6–12 months.
What role does driver behavior play in fleet fuel consumption?
Driver behavior determines 20–30% of fleet fuel consumption variance. Hard acceleration, excessive speed, and poor idle habits are controllable through eco-driving training, yielding 10–15% sustainable fuel economy improvement when combined with real-time feedback systems.
Can fuel management software integrate with existing telematics platforms?
Yes. BusCMMS integrates with Samsara, Geotab, and other telematics platforms to receive real-time fuel and energy consumption data, idle time tracking, driver behavior metrics, and engine diagnostics—consolidating everything into unified fuel analytics.
How do I calculate ROI for fuel optimization investments?
Calculate baseline annual fuel spend (gallons × price per gallon). Measure fuel consumption improvement percentage. Multiply savings × diesel price to quantify annual benefit. Most idle reduction and eco-driving initiatives pay for themselves within 3–6 months on a 50+ bus fleet.
What is the total cost of ownership difference between diesel and electric buses for school districts?
Diesel bus TCO: $750,000–$900,000 over 12-year lifespan ($0.65/mile). Electric bus TCO: $600,000–$750,000 over 12-year lifespan ($0.35/mile) with federal rebates covering 50–100% of incremental purchase price. Electric buses often have lower total cost of ownership despite higher upfront cost.
Our fuel budget was always blown by October. We had no idea where it was going. BusCMMS connected our maintenance records with Samsara telematics data and suddenly we could see which buses were burning through fuel and why. We identified three buses with engine problems that were costing us combined $400/month in wasted fuel. Fixed them, saved almost $5,000 year 1. That alone justified the software.
Stop Burning Fuel Without Tracking Where It Goes
BusCMMS integrates maintenance data with telematics analytics to reveal fuel waste patterns—enabling data-driven optimization across driver behavior, idle reduction, and predictive maintenance interventions.







