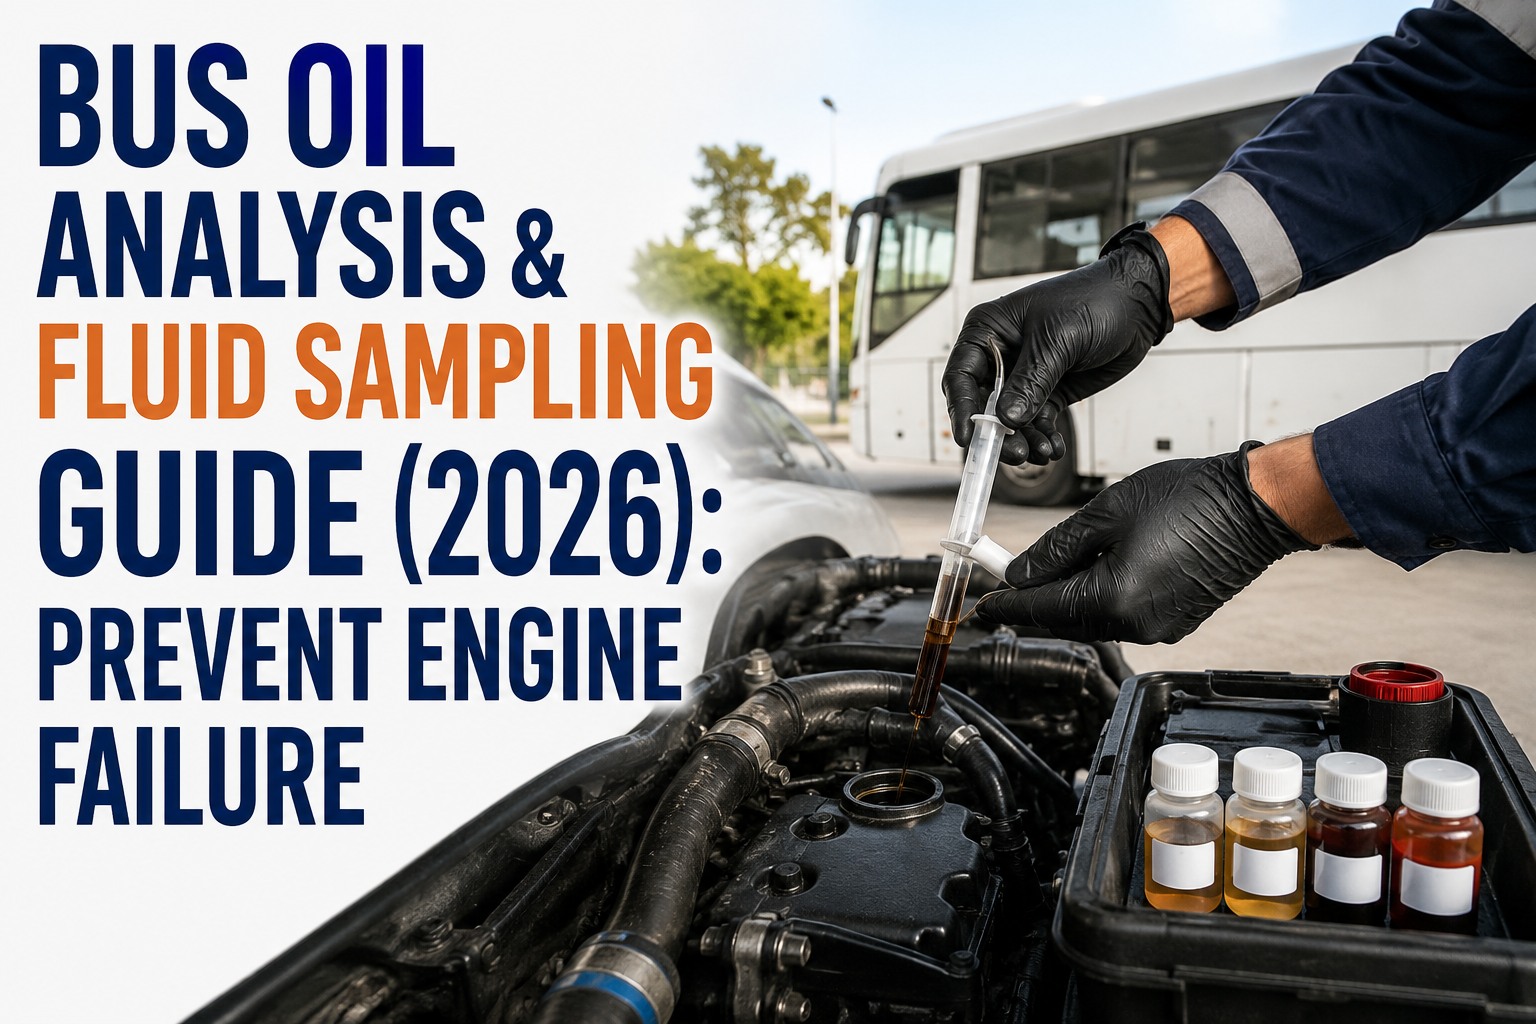
Your best diesel bus sounds fine, ran pre-trip fine, and just crossed 200,000 miles. But a 4-ounce oil sample -- mailed to a certified lab for $18 -- just told you a wrist pin bearing is failing. Bus oil analysis catches $22,000 engine failures three months before they happen. This guide shows you exactly how to read the report, take the sample, and turn lab results into work orders that save engines.
Bus Oil Analysis & Fluid Sampling Guide
The $18 lab test that catches $22,000 engine failures -- decoded for fleet managers
- $18Per sample cost
- 3 moAdvance warning
- 8+Wear metals tracked
- FeIron42 ppmWARN
- CuCopper8 ppmOK
- SiSilicon28 ppmHIGH
- FDFuel Dilution2.1%OK
What a $18 Oil Sample Actually Tells You
Oil is the blood of a diesel engine. Every metal particle, drop of fuel, water molecule, and combustion byproduct that ends up in the oil pan tells a story about what is happening inside the engine at the microscopic level. A certified oil lab reads that story with three overlapping tests: wear metal spectroscopy, physical and chemical condition analysis, and contamination screening. One 4-ounce sample answers three questions your engine cannot tell you any other way.
Wear Metals
Which internal components are wearing, and how fast. Iron, copper, chromium, aluminum, lead, and tin each point to a specific part.
SpectroscopyOil Condition
Is the oil still doing its job. Viscosity, TBN (acid-fighting reserve), oxidation, and soot loading measure how much life is left.
ChemistryContamination
What should not be in your oil. Dirt (silicon), fuel dilution, water, glycol (coolant leak) all point to system-level failures.
Screening
A commercial fleet manager who reads all three sections in 90 seconds gets a diagnosis better than a $500 shop tear-down inspection. Miss any of them and you are paying for the sample without getting the answer. Book a demo to see how BusCMMS logs each of these three test categories per bus over time.
The Wear Metal Decoder: What Each Element Means
Every metal in your engine wears at some measurable rate. When those metals show up in the oil, spectroscopy quantifies them in parts-per-million. Each element points to a specific component or family of components. Learning to read them is like learning to read a driver's DVIR notes -- once you know the language, the diagnosis is obvious.
- FeIronCylinders, camshaft, crankshaftWatch >50 ppm
- CuCopperBearings, bushings, oil coolerWatch >20 ppm
- CrChromiumPiston rings, cylinder linersWatch >15 ppm
- AlAluminumPistons, some bearingsWatch >20 ppm
- PbLeadBearing overlayWatch >30 ppm
- SnTinBearing alloyWatch >15 ppm
- SiSiliconDIRT ingestion (air filter fail)Red flag >20 ppm
- NaSodiumCOOLANT leak (head gasket)Red flag >20 ppm
The two red-flag elements -- silicon and sodium -- are not wear metals at all. They are intruders. Silicon means your air filter is letting dirt through, which destroys engines fast. Sodium means coolant is leaking into your oil, which can also destroy engines fast. Either one on a report demands an immediate work order. Book a demo to see how BusCMMS triggers work orders when Si or Na cross their thresholds.
Reading Your First Oil Analysis Report
A typical lab report looks intimidating on the first read -- rows of numbers, chemistry abbreviations, threshold columns. Once you know what to look for, it takes 90 seconds. Every commercial oil lab report has the same four sections. Learn them once and you can read any report the industry produces.
Wear Metals (ppm)
- Iron (Fe)42WARN
- Copper (Cu)8OK
- Chromium (Cr)4OK
- Aluminum (Al)6OK
Condition
- Viscosity @ 100C13.8 cStOK
- TBN7.2OK
Contamination
- Silicon (Si)28 ppmHIGH
- Fuel Dilution2.1%OK
Read the sections in order: identification, wear metals, condition, contamination, recommendation. Green rows are normal. Yellow rows deserve attention at the next PM. Red rows demand a work order today. That is the entire skill -- and it takes about a week of reading reports before it becomes second nature. What kills most oil analysis programs is not the science. It is that the reports arrive as PDFs in the shop foreman's email, get printed and filed, and never make it into the maintenance schedule. The lab did its job. The system on the receiving end failed. Book a demo to see how BusCMMS parses lab reports into work orders automatically.
How to Take a Sample Correctly (Bad Samples = Bad Data)
The most accurate lab in the world cannot fix a bad sample. Most fleet oil programs fail because someone pulls the sample from the drain plug (contaminated), from a cold pan (particles settled), or after the oil sat for a week (values shifted). Get the sample right and the lab does the rest.
- 01
Warm the Engine
Run 10 minutes to normal operating temperature. Hot oil suspends wear particles evenly. Cold oil lets them settle.
- 02
Extract Mid-Stream
Sample from the middle of the oil column via sample port or vacuum pump into the dipstick tube. Never from the drain plug.
- 03
Label + Document
Record bus ID, engine model, mileage, oil brand and grade, miles on this oil charge, sample date. The lab needs all of it.
- 04
Ship Promptly
Same-day or overnight to the lab. Samples sitting on a shop shelf for two weeks give unreliable readings.
Fleets that skip these four steps see 30-40% of samples flagged as "insufficient" or "contaminated" by the lab -- which means paying $18 for nothing. Fleets that follow the procedure get actionable data every time. Sign up free and add oil sampling as a scheduled PM task per bus.
One Sample Is Data. Six Samples Is a Diagnosis.
A single oil report is a snapshot. Six samples over 30,000 miles is a trend line -- and trend lines are where oil analysis actually earns its money. Wear metals rising slowly means normal steady operation. Metals climbing sharply means something inside the engine is failing. Below is a real trend pattern for iron ppm across six samples on a failing bus.
Any single sample above would read "borderline" or "slightly elevated" -- easy to file and forget. The pattern across six samples reads "cylinder liner wear accelerating, plan a rebuild before winter." That is a completely different maintenance decision, and it only becomes visible when the samples live in a system that trends them automatically. Fleets that log samples in a CMMS catch problems that fleets storing PDFs in email folders miss entirely. The math on this is not close: BusCMMS reports districts running trended oil analysis catch roughly 3-4 major engine problems per year they would otherwise miss, based on customer-reported outcomes. Each catch is worth $15,000-$25,000 in avoided rebuilds. Book a demo to see per-element trend graphs for every bus in your fleet.
Beyond Engine Oil: Coolant, Transmission & Hydraulic Sampling
Engine oil gets the most attention because engine rebuilds are the most expensive failure. But three other fluids deserve regular sampling on any serious fleet program: coolant, automatic transmission fluid, and hydraulic fluid where equipped (wheelchair lift systems, air suspension leveling). Each has its own failure signature.
Coolant Analysis
Annual or 100K mipH, freeze point, glycol %, iron and copper (radiator/oil-cooler wear), exhaust gas presence (head gasket leak).
Transmission Fluid
Every 30-50K miAluminum and brass ppm (clutch wear), viscosity, oxidation, particle count. Predicts trans failures 20-40K mi out.
Hydraulic Fluid
Annual (lift systems)Particle count, water content, viscosity. Critical on ADA wheelchair lifts where hydraulic failure = out-of-service.
Running all four fluid programs on a bus fleet takes coordinated scheduling per vehicle -- something no paper system handles well. Book a demo to see all four fluid sampling schedules automated per bus.
How BusCMMS Turns Oil Reports Into Work Orders
A lab report sitting in an email inbox is worthless. A lab report loaded into a fleet CMMS where it triggers work orders, trends per bus, and alerts your shop foreman -- that is predictive maintenance. Generic fleet software does not know what iron ppm means. A bus-specific CMMS does.
Sampling Schedule per Bus
PM triggers oil sample tasks automatically at the right mileage per vehicle.
Digital Report Archive
Every lab result stored per VIN. Instant search, export for warranty claims, no lost PDFs.
Wear-Metal Trend Graphs
Iron, copper, silicon, and every other element plotted per bus over time.
Threshold Work Orders
Silicon spikes past 20 ppm? Work order for air filter service auto-created and assigned.
Extended-Drain Justification
Prove the oil still has life. Extend drain intervals safely with lab data behind you.
Cost-per-Mile Tracking
Roll oil program costs into per-bus, per-mile totals. Board-ready fleet analytics.
BusCMMS reports districts using its oil analysis workflow catch engine problems 60-90 days earlier than fleets tracking samples on paper, based on customer-reported outcomes -- meaning most catch-worthy failures are found while the bus is still safe to run. Book a demo to see oil analysis integrated with your existing PM workflow.
The Bottom Line on Bus Oil Analysis
Oil analysis is the cheapest predictive maintenance decision a fleet manager makes. $18 per sample, four times a year per bus, is $72 annually to protect a $22,000 engine. The only way it fails is if the reports get lost in email, samples get skipped, or nobody trends the results. All three problems disappear when the program lives in a CMMS built for buses. Sign up free and load your first sample this week.
What is bus oil analysis?
Bus oil analysis is a laboratory test that examines a small sample of used engine oil (typically 4 ounces) to identify wear metals, oil condition, and contamination. Certified labs use spectroscopy to quantify iron, copper, chromium, aluminum, lead, tin, silicon, and sodium in parts-per-million; measure viscosity, TBN, and oxidation; and screen for fuel dilution, water, and coolant. The results predict engine failures 30-90 days before they cause a breakdown, at a cost of $15-25 per sample.
How often should bus oil samples be taken?
Most commercial fleets sample at every oil change (typically every 5,000-15,000 miles depending on service class). Extended-drain programs sample every 3,000-5,000 miles between changes to prove oil is still fit for service. New engines should be sampled at break-in, then quarterly. Buses with a suspected problem should be sampled more frequently until the trend clears. School buses averaging 25,000 miles/year typically run 2-4 samples annually per bus.
What do high iron levels in bus oil mean?
Iron in engine oil comes from cylinder walls, cylinder liners, camshaft, crankshaft, and other ferrous internal components wearing normally over time. Baseline iron for a healthy diesel engine is usually 5-25 ppm. Iron above 50 ppm is a warning; iron rising sharply between samples indicates a specific component is failing. The trend line matters more than any single reading -- a slow rise is normal, a steep rise is a diagnosis. Silicon contamination alongside high iron typically points to dirt ingestion accelerating wear.
Can oil analysis extend oil change intervals?
Yes, and this is where oil analysis often pays for itself the fastest. If lab results show the oil still has adequate TBN, acceptable wear metals, and no contamination at the standard drain interval, fleets can extend intervals by 25-50% with lab data as justification. On a 50-bus fleet running 25,000 miles per year, extending oil change intervals from 10,000 to 15,000 miles can save $15,000-30,000 annually in oil, filters, and labor -- while maintaining warranty coverage.
How does BusCMMS help manage oil analysis?
BusCMMS ships with oil sampling as a scheduled PM task per bus, mileage or calendar triggered. Every lab report is stored digitally per VIN with a full audit trail. Wear metal values trend over time in per-bus graphs. When any element crosses its threshold (silicon >20 ppm, sodium >20 ppm, iron >50 ppm, etc.), a work order is auto-created and assigned to the shop foreman with the recommended action. Coolant, transmission fluid, and hydraulic fluid samples all track alongside engine oil on one dashboard.







