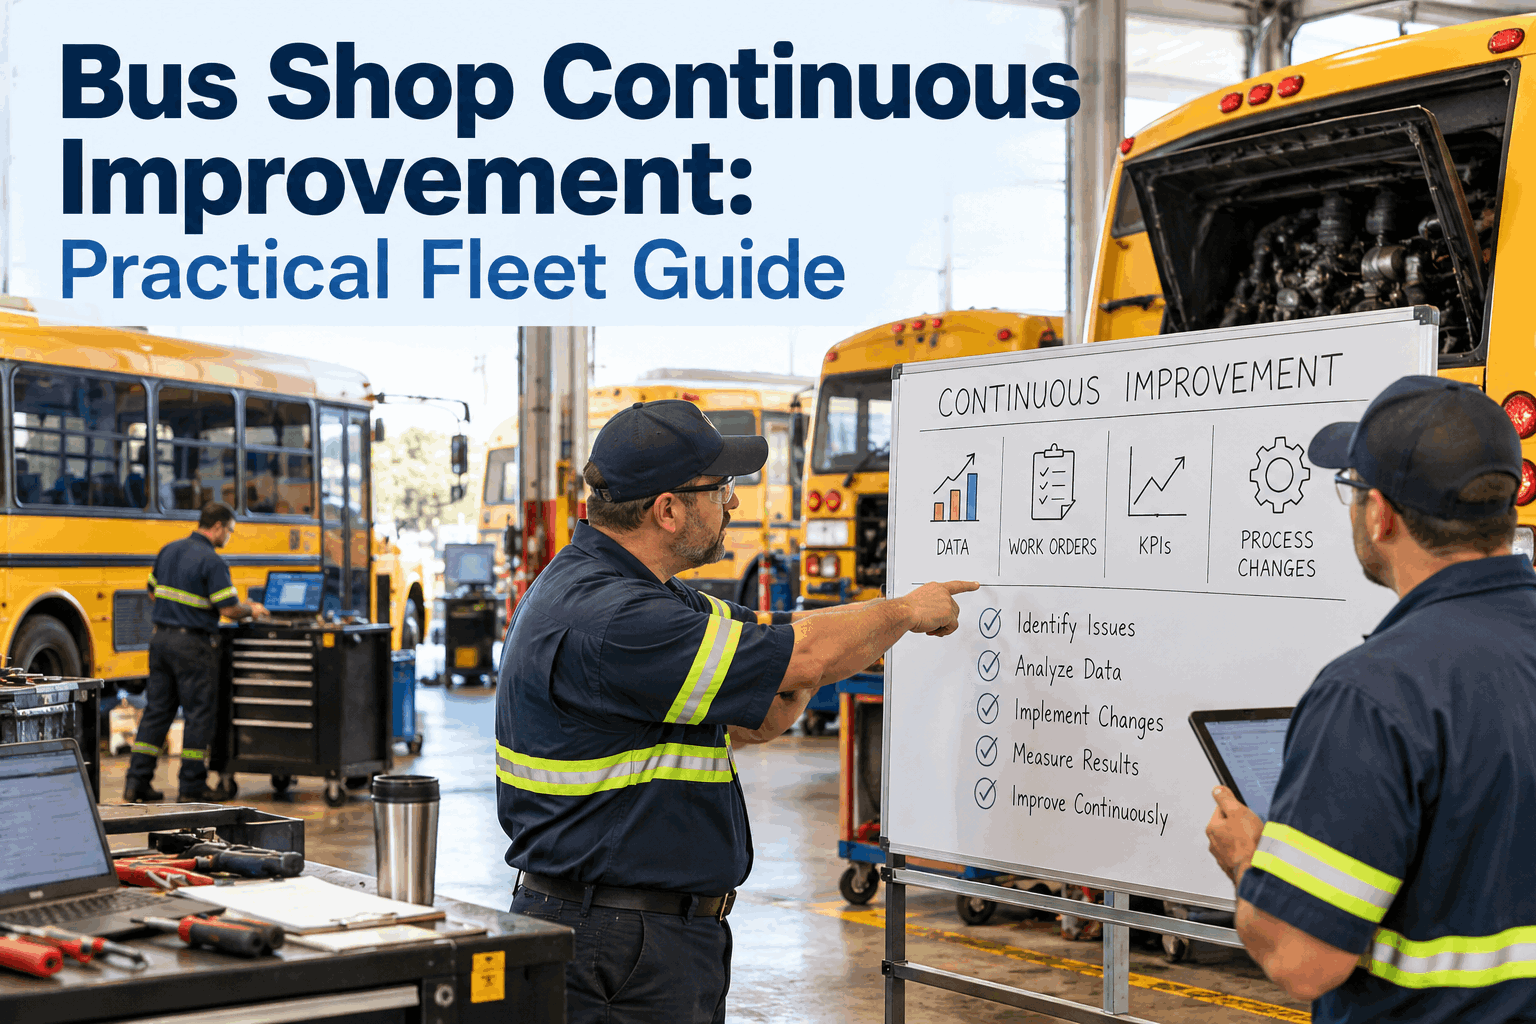
The first year with a real maintenance system feels great — road calls drop, PM compliance climbs, everyone can see the shop getting better. Then year two hits a wall. The easy wins are gone, the numbers flatten out, and "keep improving" turns into a vague pep talk nobody knows how to act on. That plateau is where most shops park. Bus shop continuous improvement is the way past it: a repeatable loop that uses the data you already collect to find the next problem, fix it, and prove the fix held — over and over, long after the obvious wins are spent.
Bus Shop Continuous Improvement: A Practical Guide
A repeatable loop that turns the data you already collect into your next fix — measure, target, change, verify — so the shop keeps getting better long after the easy wins are gone.
Why Bus Maintenance Improvement Stalls
Improvement rarely stops because a shop stops caring. It stops because the way the first gains happened doesn't scale. The early wins came from fixing obvious, visible problems — the bus that was always broken, the PM everyone knew was overdue. Once those are gone, the remaining problems are smaller, buried in the data, and invisible to gut feel. Without a method for finding them, the shop coasts on last year's gains and calls it steady.
The Numbers Flatten
Road calls and downtime dropped fast, then stopped moving. The graph goes flat and nobody's sure whether that's as good as it gets or a problem hiding in plain sight.
Problems Hide in the Data
The next win isn't a bus that's obviously bad — it's a repair that keeps coming back on eight buses, or a slow creep in cost per mile. You can't fix what you never surface.
No Time to Analyze
A slammed shop reacts to today's breakdowns, not last quarter's patterns. Improvement needs a look back at the data, and there's never a spare hour to dig for it by hand.
Changes Don't Stick
Even when the shop does change something, nobody checks whether it worked or made it standard. The improvement fades, the old habit returns, and the gain quietly evaporates.
The common thread is that continuous improvement isn't a mindset problem — it's a method problem. A shop full of good people will still plateau if there's no repeatable way to surface the next issue and confirm the fix worked. The good news is that a bus shop already generates exactly the data an improvement loop needs: every work order, PM, fuel entry, and repair is a data point about what's actually happening. The shops that keep improving are the ones that put that data to work instead of letting it sit in a system nobody reports on. Book a demo to see how your shop's own data drives the next improvement.
The Continuous Improvement Loop for a Bus Shop
Continuous improvement sounds abstract until you make it a loop you actually run on a schedule — monthly or quarterly. Four stages, done in order, turn "get better" into a process any maintenance manager can execute. The power isn't in any single stage; it's in running the whole cycle again and again, each pass raising the baseline for the next.
Measure — Set the Baseline
You can't improve what you haven't measured. Start each cycle by pulling the current numbers — cost per mile, fleet availability, PM compliance, repeat repairs, road calls. This baseline is what every change gets judged against, so the improvement is real, not a feeling.
Target — Pick the One Worst Offender
Don't try to fix everything. Let the data name the single biggest drag — the repair that recurs most, the bus with the worst cost per mile, the PM type slipping most often — and aim the whole cycle at that one thing. Focus is what makes the gain measurable.
Change — Make One Deliberate Fix
Change one thing on purpose — adjust a PM interval, swap a failing part brand, retrain on a procedure, reorder a parts threshold. One change at a time means that when the number moves, you know exactly what moved it.
Verify — Confirm It Held, Then Standardize
Run the number again next cycle. If it improved, make the change the new standard so it sticks. If it didn't, you learned something cheap — revert and try another angle. Then start the loop over on the next-worst offender.
If this feels like lean or kaizen dressed for a bus shop, that's exactly what it is — the same measure-change-verify discipline that manufacturing has used for decades, pointed at fleet maintenance. The reason it works here is that a bus shop's outcomes are so measurable: downtime, cost per mile, and repeat repairs are hard numbers, not opinions. The only thing standing between most shops and this loop is the effort of pulling the data each cycle, which is precisely where analytics earns its keep. Sign up free and run your first improvement cycle on real numbers.
How to Pick What to Fix Next
The whole loop lives or dies on stage two: choosing the right target. Guess wrong and you spend a cycle improving something that didn't matter. The trick is to let the data rank your problems by impact, so the biggest lever gets pulled first. A handful of views in your maintenance analytics point straight at where the next win is hiding.
Repeat Repairs
The same fix showing up again and again means the root cause was never addressed. Repeat-repair data is often the richest vein of improvement in the whole shop.
Cost Per Mile Outliers
Rank buses by cost per mile and the few at the top are eating the budget. One or two outliers usually explain a big share of overspend — a clear, fundable target.
MTBF & MTTR Trends
Falling mean time between failures or rising mean time to repair flags a system getting worse or a bottleneck in the shop — a direction to point the next cycle before it becomes road calls.
PM Compliance Gaps
A PM type or fuel class that keeps slipping past due is a leading indicator of future breakdowns. Closing that gap is a change you can make now and measure next cycle.
Notice these are inputs to the loop, not a scorecard to admire — each one exists to answer a single question: what's the biggest problem I can fix this cycle? If you want the full catalog of which numbers to watch, that's its own subject; our rundown of the maintenance KPIs every fleet should track covers it. Here, the point is narrower: pick the one signal pointing at the biggest drag, and make that your target. Book a walkthrough to see repeat-repair and cost-per-mile outliers surfaced automatically.
Making a Change Actually Stick
Most improvement efforts don't fail at the change — they fail at what comes after. A shop tries something, it seems to help, and then nobody confirms the gain or locks it in. Three cycles later the old way is back and the number has crept up again. The difference between a shop that improves and one that just churns is entirely in how the change gets verified and standardized.
- Change made on a hunch, no baseline to compare
- "Seems better" replaces an actual measurement
- Several things changed at once — cause is unknown
- No one revisits the number the next cycle
- The old habit quietly returns and the gain is lost
- Baseline captured before the change
- One deliberate change, so the cause is clear
- Number re-checked next cycle against the baseline
- Verified gain written into the standard procedure
- Locked in, then the loop moves to the next target
The right column is only possible when measuring is effortless — when re-checking a number next cycle takes a glance at a dashboard, not a day rebuilding a spreadsheet. That's the practical reason so many improvement programs die: the verify step is too much work by hand, so it gets skipped, and unverified changes don't last. Automated reporting is what makes the loop sustainable, and it's also how you show leadership the gain was real when it's time to justify the budget — the kind of thing a solid maintenance report for leadership is built on. Sign up free and make verifying a change a one-glance job.
The Analytics Engine Behind Bus Shop Continuous Improvement
Every stage of the loop runs on data, which is why analytics and reporting is the engine of continuous improvement, not a nice-to-have. BusCMMS turns the work orders, PMs, and fuel entries your shop already logs into the baselines, targets, and proof the loop needs — so improving isn't a special project, it's just reading your own numbers and acting on them.
-
Real-Time KPI Dashboards
Cost per mile, fleet availability, PM compliance, and MTBF/MTTR live on one screen — the baseline for every cycle, always current, no spreadsheet rebuild required.
-
Repeat-Repair Detection
Surfaces the fixes that keep coming back across the fleet — the richest improvement targets — so stage two of the loop points at a real root cause, not a guess.
-
Cost-Per-Mile Ranking
Ranks every bus by true cost per mile so the budget-eating outliers are obvious — a fundable target you can take straight to leadership with the numbers behind it.
-
Trend Tracking Over Time
See whether this cycle's number beat last cycle's — the verify step made automatic, so you know a change held instead of hoping it did.
-
PM Compliance Analytics
Shows which PM types and fuel classes slip most, turning a leading indicator of future breakdowns into a change you can make now and measure next cycle.
-
Board-Ready Reports
Turn a cycle's gains into a clean report in minutes — the proof that improvement is happening, in the language a board or agency understands.
The reason this matters for bus shop continuous improvement specifically is that a purpose-built bus platform already understands the data — it knows a repeat brake-chamber repair from a one-off, and it tracks cost per mile by bus and fuel type out of the box, rather than making you build those views from raw exports. That removes the single biggest excuse for the loop dying: "we didn't have time to pull the numbers." When the baseline, the target, and the proof are all a click away, running an improvement cycle every month stops being a project and becomes a habit.
A Maintenance Manager's Take
That's continuous improvement in one story: the plateau wasn't a lack of effort, it was a hidden problem the data finally surfaced. One targeted change, verified and standardized, got the shop moving again — and the monthly loop is what keeps it moving.
The Bottom Line on Bus Shop Continuous Improvement
Bus shop continuous improvement isn't a mindset you exhort people into — it's a loop you run: measure the baseline, target the one worst offender the data names, make a single deliberate change, and verify it held before standardizing it and moving to the next. Shops plateau not because they stop caring but because the easy wins are gone and the remaining problems hide in the data, invisible to gut feel. The way past the plateau is to let your own work-order, PM, and cost data rank your problems by impact, fix the biggest one, and prove the fix worked — then do it again next month. That's where analytics and reporting stops being a dashboard you glance at and becomes the engine of a shop that keeps getting better. The loop is simple; the discipline of running it, backed by data that makes each step a click instead of a chore, is what separates a shop that improves from one that just stays busy. Book a walkthrough to see the improvement loop running on a fleet like yours.