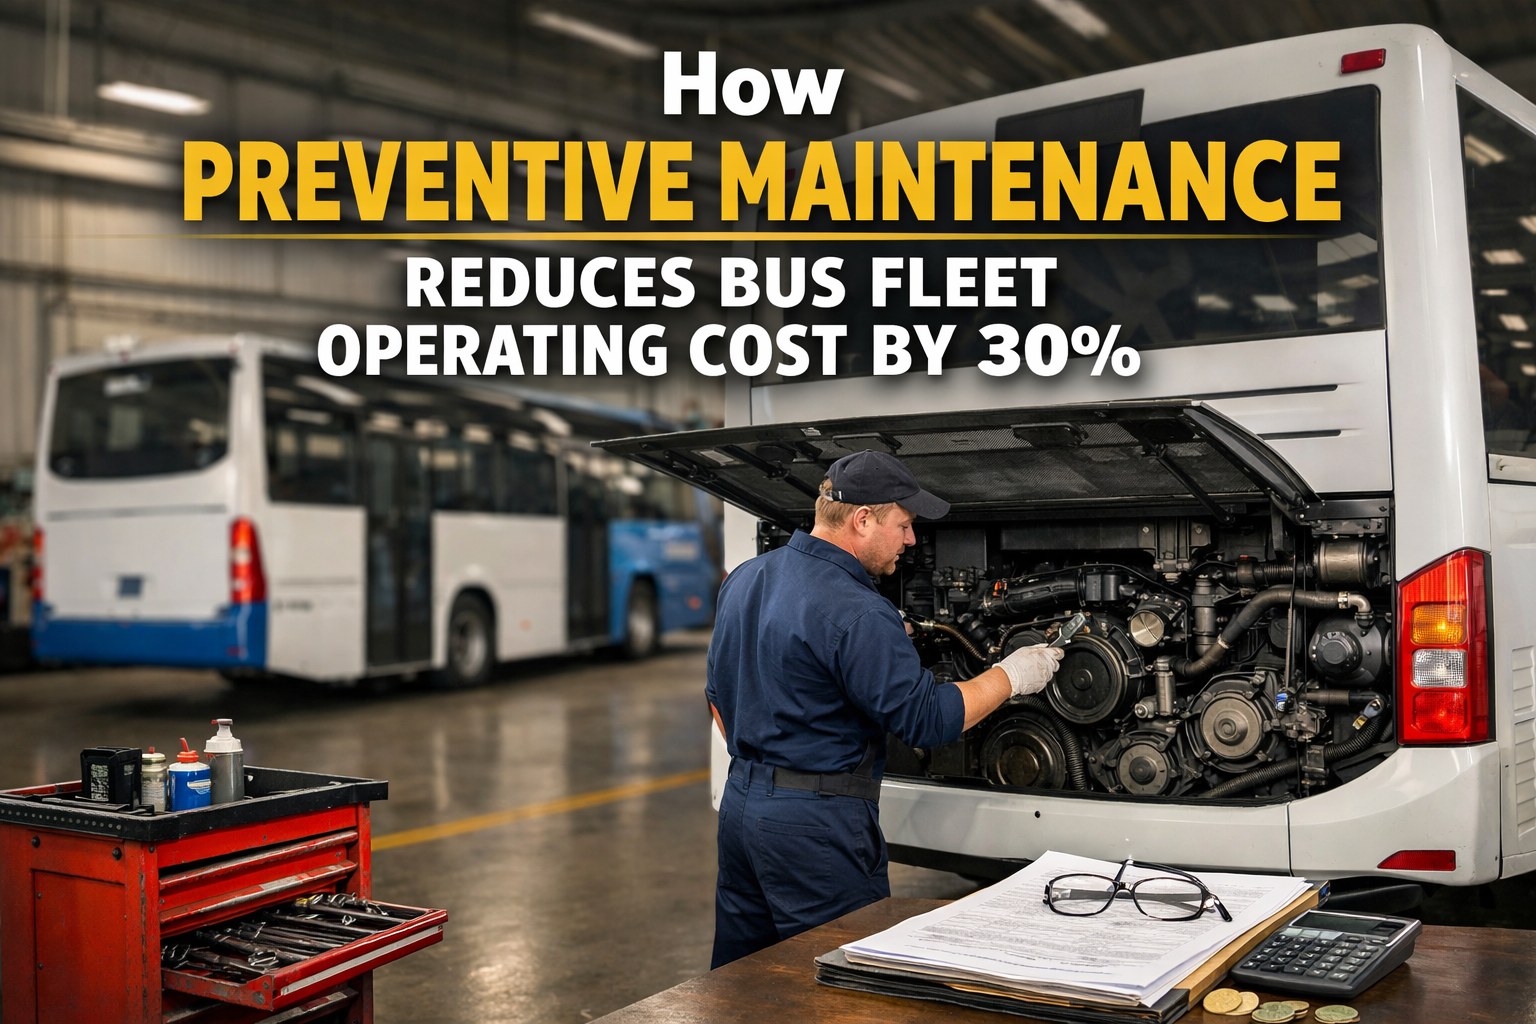
Here's a reality checkIndustry benchmarking studies show top-performing fleets operate at 80-85% planned maintenance and they spend 25-35% less than reactive operations. The difference? Timing. This guide shows you exactly where that 25-30% savings comes from—and how to capture it for your fleet.
*Fuel savings based on proper tire pressure, clean air filters, and regular engine tuning.
Source: DOE FEMP O&M Best Practices Guide + ATRI 2025 Operational Costs Report
Why Reactive Maintenance Costs 3-4x More
A scheduled $150 oil change prevents an $8,000 engine failure. That's not speculation—it's the math that separates profitable fleets from struggling ones. Here's how costs multiply when you wait for breakdowns:
According to the Federal Energy Management Program (FEMP) by the U.S. Department of Energy, organizations using preventive maintenance programs save 12-18% on total maintenance costs compared to reactive approaches. For bus fleets with high downtime penalties, savings typically reach 25-30%.
The Preventive vs. Reactive Cost Comparison
Let's look at real numbers for a 50-bus fleet over one year. The difference is striking:
*Based on average $3,500 per breakdown × 15 incidents (reactive) and 5.5 incidents (PM). Downtime calculated at $600/day × 2 days average per breakdown.
The boardroom metric: Fleets optimizing preventive maintenance typically reduce maintenance cost-per-mile by 10-18% within the first year—a number that resonates with CFOs and board members.
The paradox is clear: spending more on scheduled maintenance means spending less overall. Want to see exactly how this applies to your fleet? Book a free demo to get a personalized cost analysis.
5 Areas Where PM Delivers Maximum Savings
Brake Systems
$200 pad replacement vs. $3,500 rotor + caliper damage
Savings: $3,300 per incidentEngine Oil & Filters
$150 scheduled service vs. $8,000+ engine rebuild
Savings: $7,850 per incidentCooling Systems
$400 coolant flush vs. $6,000 head gasket failure
Savings: $5,600 per incidentTransmission Service
$350 fluid change vs. $12,000 transmission replacement
Savings: $11,650 per incidentTire Rotation & Alignment
$150 service vs. $4,000 premature tire replacement
Savings: $3,850 per incidentLearn exactly which PM tasks deliver the highest ROI in our complete preventive maintenance guide for school buses. Ready to automate your PM scheduling? Start your free trial today.
The Fleet Performance Benchmark
Where does your fleet stand? Industry research shows clear performance tiers:
Fleets achieving 80-85% planned maintenance spend 25-35% less than those stuck at 50-60% reactive work. The difference compounds over time—every prevented breakdown saves $3,000-$8,000 in direct and indirect costs. See exactly how much you're losing to downtime in our bus fleet downtime cost analysis.
How CMMS Makes 25-30% Savings Achievable
Manual tracking can't deliver consistent PM execution. See how the top-rated bus maintenance software solutions compare. Here's what digital fleet maintenance management enables:
Never miss a service interval. Alerts trigger based on mileage, hours, or calendar—whichever comes first.
Track consumption patterns. Auto-reorder at thresholds. Eliminate $50-200 emergency shipping fees per rush order.
Identify problem vehicles before they drain your budget. Data-driven replacement decisions save thousands.
Digital DVIRs auto-generate work orders. Small issues get fixed before they strand buses.
Fleets using comprehensive CMMS solutions report 25-30% reductions in maintenance costs, 40-50% decreases in emergency repairs, and significant improvements in vehicle lifespan. See how it works in practice: book a personalized demo.
ROI Timeline: When Savings Start
Foundation
CMMS implementation, data migration, PM schedule setup. Investment phase—minimal visible savings yet.
First Results
Emergency repairs drop 20-30%. Parts inventory optimizes. Technician productivity improves 15-20%.
Positive ROI
Most fleets achieve payback. Breakdown frequency drops 40%+. Per-bus costs trending down.
Full Optimization
25-30% total cost reduction achieved. Predictive patterns emerge. Lifecycle decisions become data-driven.
Implementation typically costs $5,000-15,000 for a 50-bus fleet. A single prevented breakdown ($4,200+) can offset months of software cost. Ready to calculate your potential savings? Start your free trial or schedule a personalized demo.
Ready to Cut Your Fleet Operating Costs by 25-30%?
BusCMMS helps school districts, transit agencies, and charter operators shift from reactive firefighting to strategic preventive maintenance. See exactly how much you can save.
Frequently Asked Questions
How much does preventive maintenance actually save on bus fleet operating costs?
Research from the U.S. Department of Energy and industry studies shows preventive maintenance reduces total fleet operating costs by 12-18% at minimum, with bus fleets typically achieving 25-30% savings due to high downtime penalties. Fleets achieving 80-85% planned maintenance spend 25-35% less than reactive operations. For a 50-bus fleet, this translates to $25,000-$40,000 in annual savings.
What's the difference between preventive and reactive maintenance costs?
Preventive maintenance costs are typically 40-45% lower than reactive (emergency) maintenance for equivalent repairs. A scheduled $150 oil change prevents an $8,000 engine replacement. Beyond direct costs, preventive maintenance eliminates emergency service premiums (1.5-2x labor rates), expedited parts shipping ($50-200+ per order), and downtime costs ($448-$760 per day per bus).
How quickly will we see ROI from implementing preventive maintenance?
Most fleets see positive ROI within 4-6 months of implementing a structured PM program with CMMS support. Emergency repairs typically drop 20-30% in the first quarter. Full optimization (25-30% cost reduction) is typically achieved within 12 months. A single prevented breakdown ($4,200+) can offset several months of software investment.
What percentage of maintenance should be preventive vs. reactive?
Industry benchmarks recommend targeting 70-80% planned maintenance and 20-30% unscheduled repairs. World-class operations achieve 80-85% planned maintenance. Reactive fleets often operate at 50-60% unplanned work—this correlates directly with higher costs and lower reliability. Moving from 60% to 80% planned work typically reduces total maintenance costs by 25-35%.
Which PM tasks deliver the highest ROI for bus fleets?
The highest-ROI preventive maintenance tasks for buses include: engine oil changes ($150 prevents $8,000+ engine damage), transmission fluid service ($350 prevents $12,000 replacement), cooling system maintenance ($400 prevents $6,000 head gasket failure), brake inspections ($200 prevents $3,500 rotor damage), and tire rotation/alignment ($150 prevents $4,000 premature replacement). Consistently executing these scheduled services helps prevent the majority of avoidable roadside breakdowns.







