Every fleet manager knows preventive maintenance saves money. The hard part is proving it. When you walk into the budget meeting to defend your maintenance software, "trust me, it is working" does not survive a finance director's questions. Proving maintenance ROI means turning what your shop does into dollar figures a board will fund.
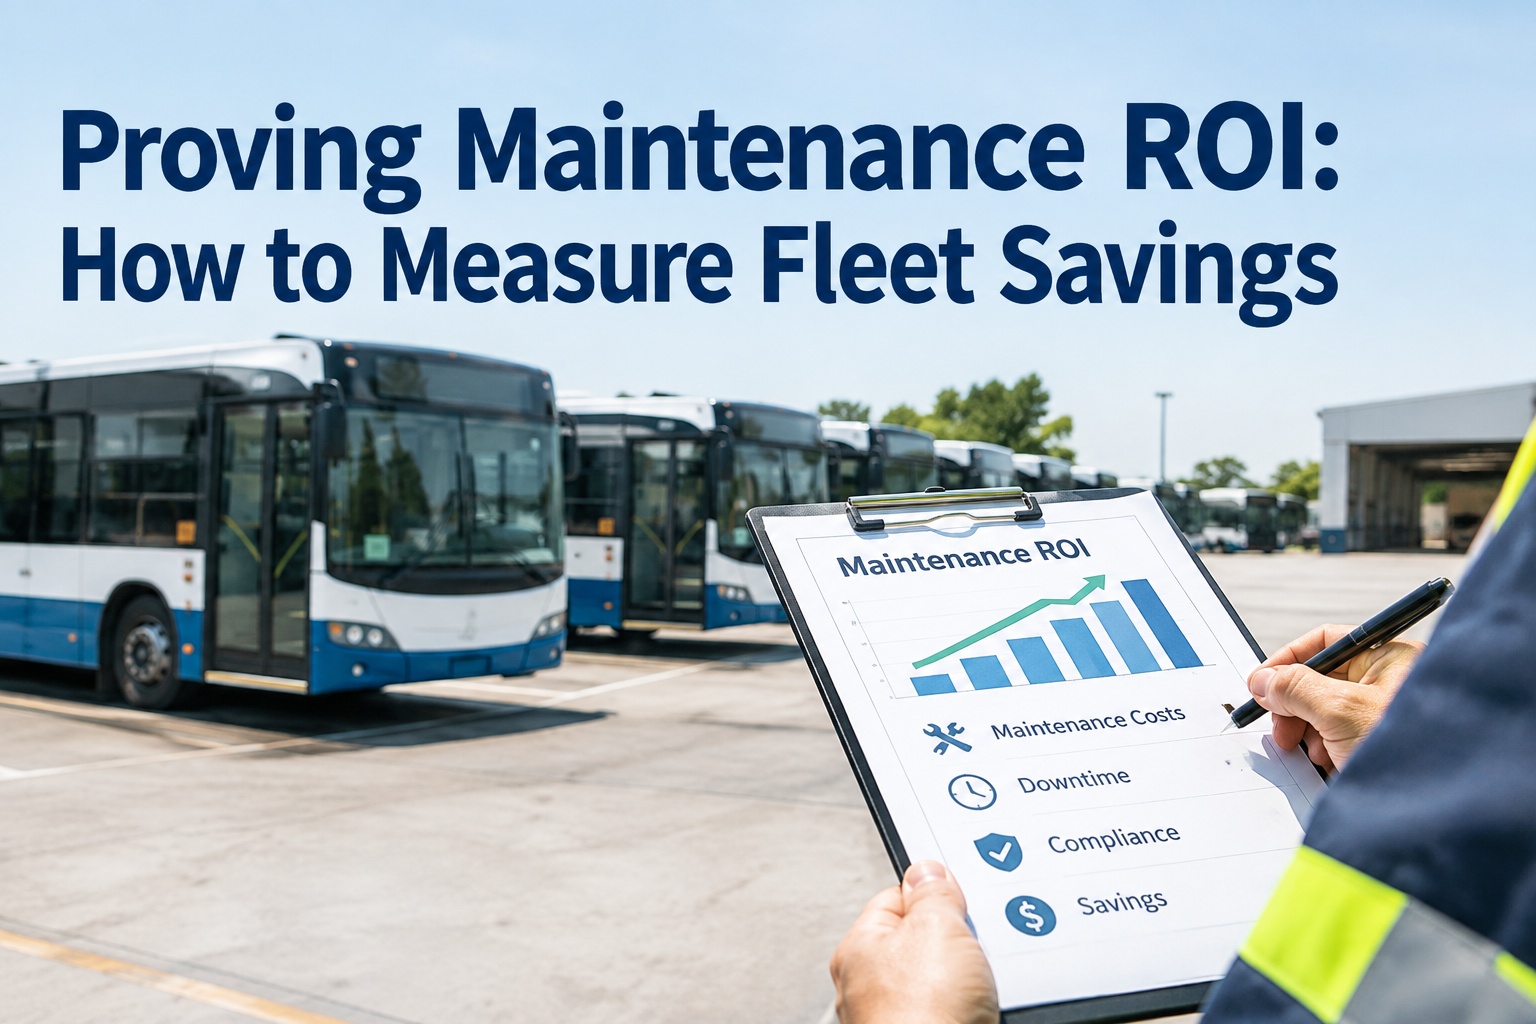
Proving Maintenance ROI: How to Measure Fleet Savings the Board Will Believe
The metrics, the formula, and the one-page business case that turns your maintenance program from a cost line into a funded investment.
- Recovered savings$250,000
- Software investment$18,000
- Net Year 1 gain$232,000
Why Your Best Work Never Shows Up in the Numbers
Here is the trap every transportation director falls into. You run a tight PM program, buses stay on their routes, breakdowns are rare -- so the board sees a maintenance budget with no drama and asks the dangerous question:
Meanwhile the cost of doing nothing is very real -- it just hides where nobody connects it back to maintenance. The gap between reactive and preventive fleets is not small money.
U.S. Department of Energy benchmark
You can book a walkthrough of the BusCMMS ROI dashboard and watch it pull those numbers live. But first, here is exactly where that money leaks out.
- Emergency Repairs3–5xthe cost of scheduled work once tows, rush parts, and overtime stack up
- Route Downtime~$650/dayper bus off the road — one breakdown becomes thousands in preventable cost
- Missed Warranty30–40%of eligible claims walk out the door when history cannot be documented
- Compliance GapsFinesand failed inspections that never get traced back to the maintenance line
The Maintenance ROI Equation That Finance Actually Respects
Proving maintenance ROI is not complicated math -- it is the same return calculation finance uses for every investment. You compare the cost you avoided against what you spent to avoid it. The hard part is not the equation; it is having clean, per-bus data on both sides.
Run it monthly and per bus. A fleet-wide annual average hides the two buses quietly dragging your whole number down.
The savings side is not one number -- it is five distinct streams, and a credible case names each separately instead of hand-waving a lump sum. Want the raw dollar math first? Our bus fleet ROI calculator runs it; this guide turns those numbers into a case the board approves.
- 1HIGHEST
Reduced Unscheduled Repairs
The biggest lever. Moving from 30% to 8% unscheduled repair spend on a 50-bus fleet recovers roughly $250K a year on its own.
- 2HIGH
Warranty Capture
Most fleets miss 30–40% of eligible claims for lack of documented history. Every captured claim is money back on the maintenance line.
- 3HIGH
Downtime Reduction
Fewer buses off the road means fewer spare-bus scrambles and route disruptions. Quantify it at your own per-day downtime cost.
- 4MEDIUM
Extended Asset Life
Disciplined PM pushes replacement out. Delaying one $120K bus purchase by even a year is real capital-budget relief.
- 5MEDIUM
Parts Optimization
Auto-reorder and duplicate-order prevention cut emergency parts costs and clear thousands in dead stock off the shelf.
The Six Numbers That Prove Your Program Is Working
A dollar figure alone gets questioned. A dollar figure backed by operational metrics gets funded. These six numbers explain why the savings happened -- track them monthly and the conversation shifts from "we spent a lot" to "here is what we bought with it."
Read that dashboard as a chain, not a list. One number causes the next, and the last one is what the board actually feels.
For a bus fleet, that last link is a safety story too -- every hour a bus is down is a route with riders waiting. Once your reactive repair ratio passes 35% you are in the expensive zone; the fleets that pull it under 20% run a real bus CMMS underneath. You can see all six metrics live in a demo before your next review.
Building the One-Page Case That Gets Approved
When you present ROI to a board, sequence matters as much as the numbers. By the time you name the software, they should already agree on the problem, the gap, and the recovery -- so approving the tool becomes obvious, not a new ask. Directors who walk through the BusCMMS reporting in a demo build this deck straight from the exports.
- 01
Name the baseline
Current cost per mile, current unscheduled repair ratio, current PM compliance. State where you are today in plain numbers before anyone can argue about direction.
- 02
Size the gap
Show the difference between your fleet and a well-run benchmark in dollars. "We run $1.60/mi; top-quartile runs $1.10. On our mileage that gap is $X per year."
- 03
Break down the recovery
Attach a dollar estimate to each of the five savings streams and total them. Named sources beat a lump sum every time.
- 04
Show the net and the payback
Savings minus investment, ROI percentage, payback in weeks. One line each. The finance director's first question is always "when do we see it back?"
- 05
Project the compound value
Years 1–3 cumulative savings plus capital deferred by extending fleet life. This is where the board sees the long game.
A good business case rests on data you did not assemble by hand the night before. A bus-specific system tracks the baseline, trend, and recovery already -- so the report exists on demand. Districts have used this exact approach to justify capital budgets. For a head start, sign up free and pull your first cost breakdown within a week.
What Proving ROI Actually Changes
The shift is not just cleaner reports. It changes the entire budget conversation from defensive to fundable. Here is what the same maintenance program looks like before and after you can measure its return.
- "We spent $1.2M on maintenance" — prompts questions you cannot answer
- Savings are invisible; the board sees only the cost
- Warranty claims missed for lack of documentation
- Software renewal is a fight every single budget cycle
- No per-bus data, so outlier buses stay hidden
- "CPM down 8%, driven by 94% PM compliance, plus $47K captured warranty"
- Savings shown in dollars, by category, on demand
- Warranty windows tracked per component, alerts before expiry
- Renewal is obvious — the tool paid for itself many times over
- Outlier buses flagged for repair-vs-replace decisions
How BusCMMS Turns Maintenance Data Into Proof
Spreadsheets and accounting cannot prove ROI on a fleet over fifteen buses -- accounting cannot tell a scheduled brake job from an emergency road call. BusCMMS is built for buses from day one, so every number the board wants is already tracked. These are the capabilities that turn your program into a defensible case.
Live ROI Dashboard
Year-to-date savings by category, updated in real time. The board number exists before you ask for it.
Cost-Per-Mile Analytics
Auto-calculated per bus, per route, per fuel type — diesel, CNG, and electric on one dashboard.
PM Compliance Tracking
On-schedule percentage per bus, shop, and technician — the metric that drives every other saving.
Warranty Capture Reports
Every component's warranty window per bus, with alerts before expiry so eligible claims stop slipping.
Audit-Ready Compliance
FMCSA, FTA, NTD, and state DOT reports generated on demand — documented DVIRs, no scramble before a review.
Board-Ready Exports
One-click monthly ROI, KPI dashboard, and cost variance — no manual formatting the night before.
BusCMMS reports customers cutting cost per mile 25 to 35 percent within 12 to 18 months (customer-reported), with rollout in two to four weeks. On a 50-bus fleet that is roughly half a million dollars a year -- the kind of number that makes a renewal a formality. See your own case: book a demo and run the ROI playbook on your fleet.
Proving Maintenance ROI Is How Your Program Survives
The fleets that keep their maintenance funding are not the ones that spend the least -- they are the ones that can prove what their spend returns. It comes down to four habits.
- Measure per bus, not fleet-wide
- Track monthly, not annually
- Break savings into named streams
- Present the recovery before the price
Do that and your maintenance program stops being a cost the board tolerates and becomes an investment they protect -- proven in a report you can defend, line by line, every budget cycle.
Frequently Asked Questions
How do you calculate maintenance ROI for a bus fleet?
Take the total savings your maintenance program recovered, subtract what you spent on the program or software, divide by that cost, and multiply by 100 for a percentage. The savings side should be broken into named streams -- reduced unscheduled repairs, warranty capture, downtime reduction, extended asset life, and parts optimization -- rather than a single lump sum. Track it monthly and per bus, not as a fleet-wide annual average, so outlier buses do not hide inside the total and the numbers hold up when finance asks for detail.
Why is proving maintenance ROI so hard?
Because a well-run program erases its own evidence. A breakdown that never happens leaves no record, and a route that was never disrupted produces no report -- so the savings are invisible while the cost is fully visible on the budget line. On top of that, maintenance savings hide in categories nobody connects back to the shop: emergency repair premiums, route downtime, missed warranty claims, and compliance fines. Proving ROI means surfacing those avoided costs and tying them to the maintenance program with real per-bus data.
What metrics should I track to prove maintenance savings to my board?
Six carry the story: cost per mile, PM compliance rate, unscheduled repair percentage, fleet availability, warranty capture rate, and downtime dollars per bus. Cost per mile is the outcome the board cares about; the other five explain why it moved. Presented together as a monthly dashboard, they turn "we spent a lot" into a cause-and-effect chain a finance committee can follow and fund. For a bus fleet, downtime is also a safety metric, since every hour a bus is off the road is a route with riders waiting.
How much can a bus fleet actually save with a CMMS?
Independent benchmarks from the U.S. Department of Energy put structured preventive maintenance at 12 to 18 percent lower total maintenance cost than reactive approaches. BusCMMS reports its own customers reducing cost per mile by 25 to 35 percent within 12 to 18 months, based on customer-reported outcomes, with payback often under six months on fleets of 25 or more vehicles. On a 50-bus fleet spending around $2 million a year, that range translates to roughly $250,000 to $500,000 in annual recovery -- far more than the software costs.
How does BusCMMS help build the ROI case for a budget meeting?
BusCMMS tracks every savings source in real time and produces board-ready reports on demand. A live ROI dashboard shows year-to-date savings by category; PM compliance displays per bus, shop, and technician; warranty capture tracks against baseline; and downtime hours convert to dollars automatically. Cost-per-mile analytics run per bus, route, and fuel type, and monthly ROI plus KPI exports come out in one click with no manual formatting. The result is that the baseline, the gap, and the recovery already exist when it is time to present -- you assemble the case from data instead of building it from scratch.