Every dollar wasted on reactive repairs, emergency parts, and unplanned downtime is a dollar that could fund fleet improvements, driver training, or service expansion. Yet most fleet managers don't know exactly how much money they're losingor how much they could save with better maintenance management.
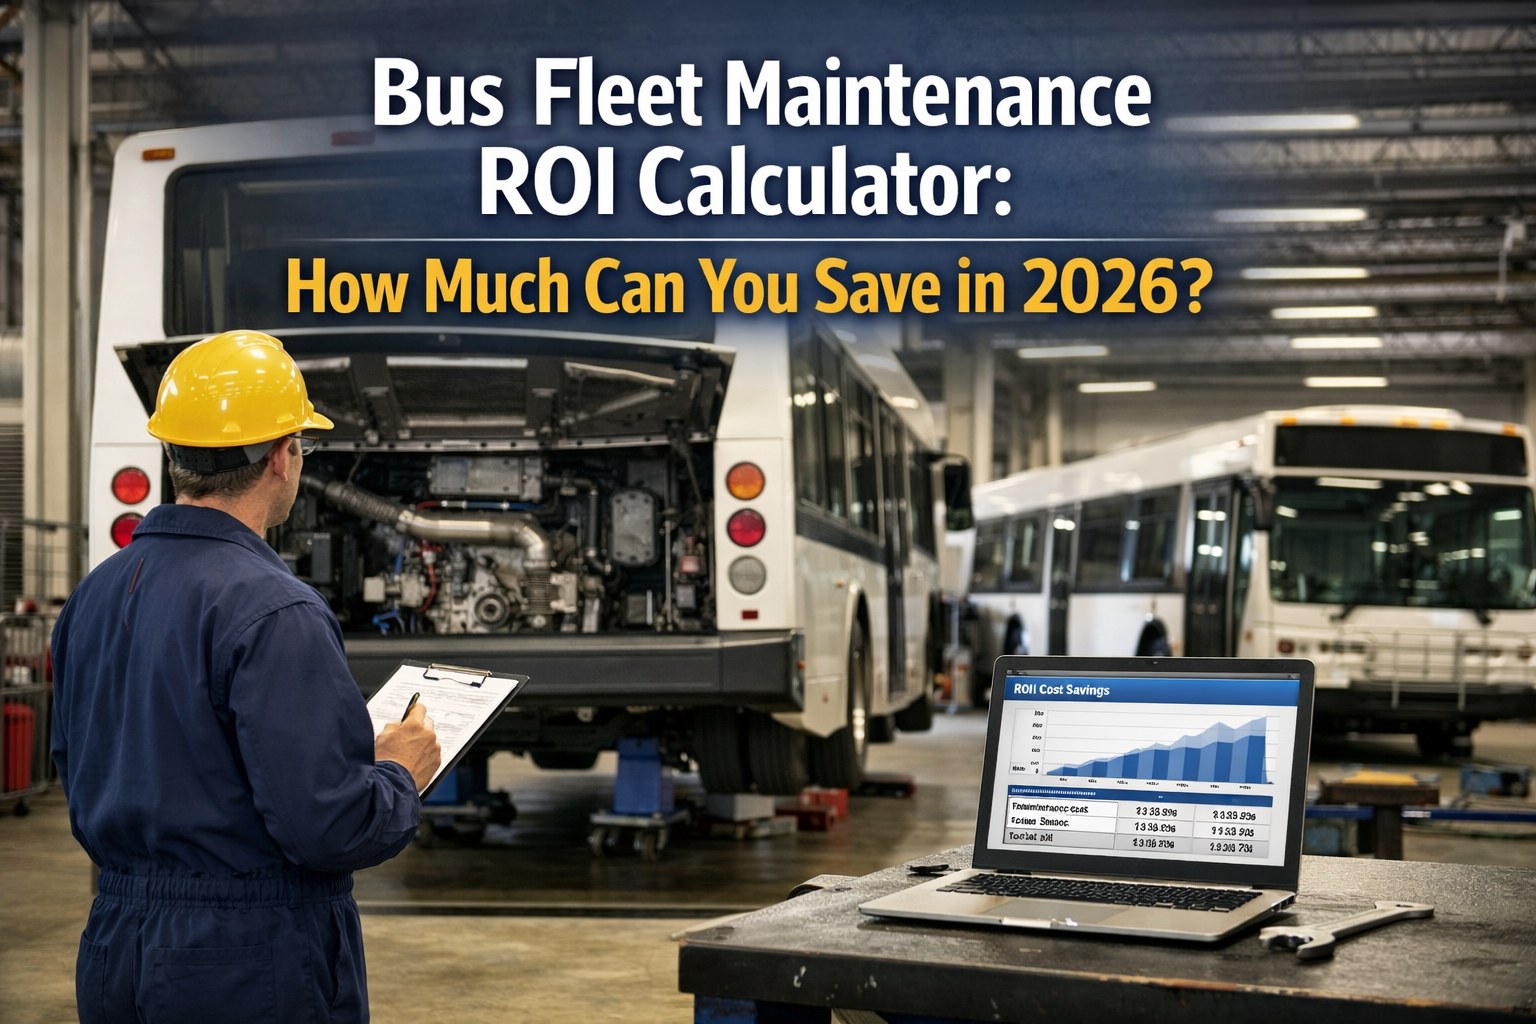
This bus fleet maintenance ROI calculator shows you the real numbers. We'll break down where maintenance dollars actually go, reveal the hidden costs most fleets miss, and give you a formula to calculate your specific savings potential. Whether you manage 25 buses or 500, understanding your ROI is the first step toward significant cost reduction.
Fleets implementing comprehensive CMMS typically reduce maintenance costs by 25-35% within the first year. For a 75-bus fleet spending $2.1M annually on maintenance, that's $525,000-$735,000 in savings—with full ROI achieved in 4-6 months. The biggest savings come from reduced reactive repairs (40%), improved labor utilization (25%), and parts optimization (20%).
Average Bus Maintenance Cost Per Mile Benchmarks
The industry average bus maintenance cost is $0.58 per mile, but top-performing fleets achieve $0.35-$0.45 per mile. This 35-40% gap represents massive savings potential—$11,500-$17,000 per bus annually for a vehicle traveling 50,000 miles.
| Fleet Type | Poor (Bottom 25%) | Average | Good (Top 25%) | Best-in-Class |
|---|---|---|---|---|
| Transit Bus (Diesel) | $0.85+/mile | $0.68/mile | $0.52/mile | $0.41/mile |
| Transit Bus (Electric) | $0.58+/mile | $0.48/mile | $0.36/mile | $0.28/mile |
| School Bus (Type C) | $0.72+/mile | $0.55/mile | $0.42/mile | $0.35/mile |
| School Bus (Type D) | $0.78+/mile | $0.62/mile | $0.48/mile | $0.38/mile |
| Charter/Motorcoach | $0.68+/mile | $0.54/mile | $0.44/mile | $0.36/mile |
Where does your fleet fall? If you're above average, the ROI from optimization is even greater. Fleets in the "poor" category typically see 35-45% cost reduction with proper CMMS implementation, while "average" fleets see 25-30%.
Fleet Maintenance Cost Breakdown
Understanding where your money goes is the first step to keeping more of it. Here's how the average bus fleet's maintenance budget breaks down—and where the biggest savings opportunities hide.
The "Downtime & Emergency" category at 15% is where reactive fleets bleed money. Best-in-class operations keep this under 5% through preventive maintenance excellence. That 10% difference on a $2M budget = $200,000 annual savings.
The Hidden Cost of Missed Preventive Maintenance
Every missed PM creates a cascade of costs that don't show up on your maintenance reports. Here's what skipping scheduled maintenance actually costs your operation:
Fleets with PM compliance below 70% typically spend 40-55% more on total maintenance than fleets at 95%+ compliance. The math is clear: consistent preventive maintenance is cheaper than reactive firefighting.
Not sure what your PM compliance rate actually is?
Get a free fleet assessment →Downtime Cost Calculator: What Each Day Really Costs
Unplanned downtime costs $450-$850 per bus per day when you factor in all impacts. Most fleets only count towing and repair costs, missing the bigger picture:
A fleet averaging 12% unplanned downtime (industry average for reactive operations) versus 4% (best-in-class) loses an extra 29 days of availability per bus annually. At $650/day average: $18,850 per bus in preventable downtime costs.
Technician Utilization: The Labor Budget Multiplier
Most fleets pay technicians for 8 hours but only get 4.5-5.5 hours of actual wrench time. The rest disappears into waiting for parts, searching for information, paperwork, and work order confusion.
That 24% improvement means each technician completes 2+ more hours of productive work daily. For a shop with 5 technicians at $35/hour fully loaded cost, that's $91,000 annual labor value recovered—without hiring anyone new. Start tracking technician productivity free and see where your time is going.
ROI Formula: Manual vs CMMS Operations
Here's exactly how to calculate your fleet's CMMS ROI. We'll compare manual operations against automated fleet management across every cost category.
| Cost Category | Manual/Paper | With CMMS | Savings |
|---|---|---|---|
| PM Compliance Rate | 65-72% | 94-98% | Fewer breakdowns |
| Reactive Repair Ratio | 40-55% | 12-18% | 60-70% reduction |
| Parts Expediting | 18-25% of parts spend | 3-6% of parts spend | $15K-$40K/year |
| Technician Utilization | 55-65% | 78-85% | 20-30% productivity |
| Warranty Capture | 45-58% | 88-96% | $8K-$18K/year |
| Admin Time Per Vehicle | 4.5 hrs/month | 1.2 hrs/month | 73% reduction |
| Audit Prep Time | 35-50 hours | 2-4 hours | 90%+ reduction |
| Unplanned Downtime | 12-18% | 3-6% | 65-75% reduction |
Annual Savings = (Current Maintenance Spend × 0.28) + (Downtime Reduction × $650/day × Fleet Size × 25 days)
ROI = (Annual Savings - CMMS Cost) ÷ CMMS Cost × 100
Example: 75 buses × $28,500 avg cost × 28% savings = $598,500 annual savings
Our fleet specialists will analyze your current costs, PM compliance, and downtime data to show exactly what you can save. No obligation, just numbers.
Who Should Use This ROI Calculator?
This calculator is built for decision-makers who control or influence fleet maintenance budgets. If any of these describe your situation, the numbers above apply directly to you:
If you're managing school bus maintenance or transit operations with 25+ vehicles, the ROI math typically works strongly in favor of CMMS implementation—often with payback in under 6 months.
Why 2026 Is the Year to Act
Budget pressure on fleet operations has never been higher. Every cost category is moving in the wrong direction, making efficiency gains more valuable than ever:
Fleets that locked in efficiency gains in 2024-2025 are now operating with 25-30% lower cost structures. Those still running manual systems are falling further behind. The gap compounds every quarter you wait. Proper preventive maintenance systems and inspection compliance tracking are no longer optional—they're competitive necessities.
Real-World Example: 85-Bus School District
Here's what happened when a mid-sized school district implemented comprehensive CMMS. This real-world case shows the timeline and specific savings achieved.
Want to see similar results for your fleet? Book a 15-minute ROI walkthrough and we'll show you exactly where your savings will come from.
Fleet Savings Estimator
Use these reference calculations to estimate your potential savings. Find your fleet size below to see conservative, average, and optimized savings projections based on industry benchmarks.
Based on $28,500 average annual maintenance cost per bus. Your actual savings depend on current efficiency levels—less optimized fleets typically see higher percentage improvements. Get your custom projection.
Frequently Asked Questions
Most fleets don't realize they're overspending until they see the numbers. A 15-minute call can reveal $200K+ in annual savings you didn't know existed.
Our fleet specialists will analyze your current maintenance data and show you exactly where you're overspending—and how much you can save. No obligation, just clarity on your ROI.