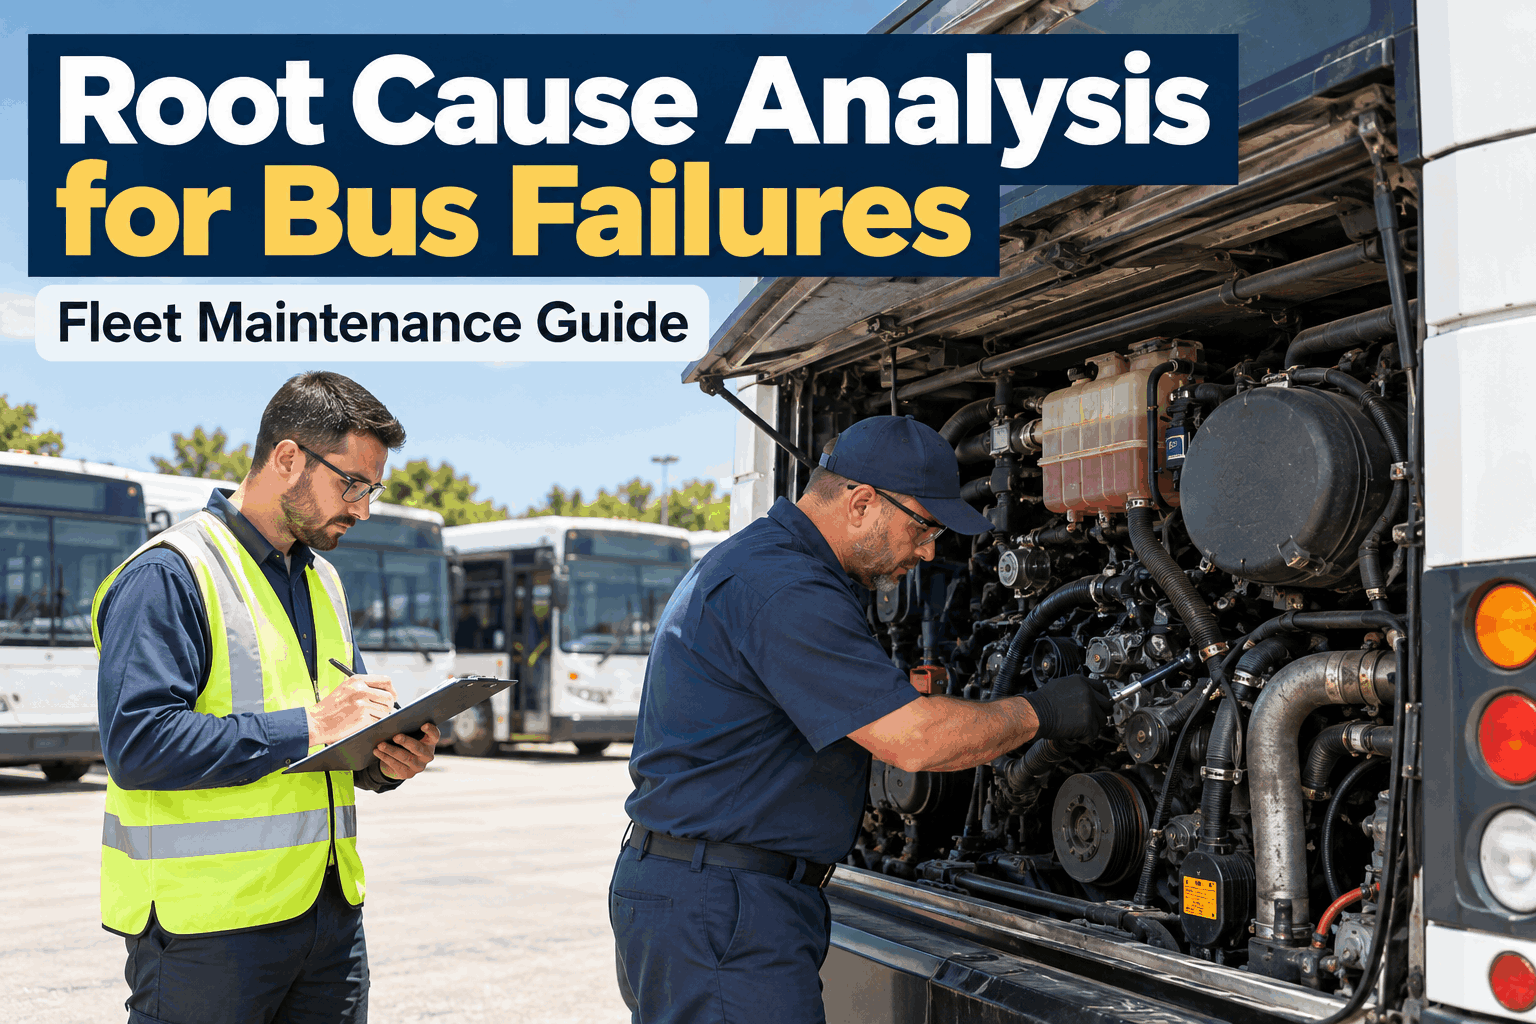
The alternator on bus 14 fails. You replace it, sign off, put the bus back on its route. Three weeks later, same bus, same alternator. You replace it again. A month after that, two more buses in the same batch do the exact same thing. At some point you stop asking "how do I fix this alternator" and start asking the real question: why does this keep happening? Root cause analysis for bus failures is the discipline of answering that question — tracing a recurring failure back to its true cause so you fix it once instead of forever.
Root Cause Analysis for Bus Failures
Recurring failures don't need another repair — they need a diagnosis. Here's how to trace a repeat bus failure back to its true cause, using your own failure history, so you fix it once instead of forever.
Why Recurring Bus Failures Keep Coming Back
A repeat failure isn't bad luck — it's a message that the last repair treated the symptom, not the cause. When a shop is slammed, the pressure is always to get the bus back on the road, which means fixing what broke and moving on. That works fine for a one-off. But when the same failure returns, "replace and release" quietly becomes an expensive loop: you pay for the part and the labor every single time, and the bus keeps coming off its route.
Replace-and-Release Loop
Swapping the failed part gets the bus rolling but never asks why it failed. The same repair comes back, and you pay parts and labor over and over for one unsolved problem.
Failures Cluster Unseen
The same fault hits several buses in a batch, but if each repair is logged in isolation, nobody sees the pattern. A fleet-wide root cause looks like five unrelated repairs.
On-Route Breakdowns
A recurring failure eventually strikes mid-route, with students or riders aboard. What was a shop annoyance becomes a stranded bus, a missed run, and a safety exposure.
Budget Bleed
Each recurrence is money spent with nothing to show for it. A single unaddressed root cause across a batch of buses can quietly account for a big slice of the repair budget.
The uncomfortable truth is that a shop can look busy and productive while losing this fight — lots of completed work orders, lots of buses turned around, and the same failures cycling through the whole time. Root cause analysis for bus failures breaks that cycle by changing the question from "what do I replace" to "what do I have to change so this never comes back." It's the difference between a shop that's always fixing and a shop that actually gets more reliable. And it starts with one distinction that trips up almost everyone. Book a demo to see recurring failures surfaced across your whole fleet.
Symptom vs Root Cause: The Distinction That Matters
Every recurring failure has two layers: the symptom you can see and touch, and the root cause buried underneath it. The symptom is the alternator that died. The root cause is the reason it died — and the reason behind that. If you only ever fix the symptom, you're signing up to fix it again. Getting good at telling the two apart is the whole skill of failure investigation.
What broke — visible, immediate, easy to fix.
- The alternator failed
- The brake pads wore out early
- The bus wouldn't start this morning
- The A/C quit on a hot afternoon
Fixing this gets the bus rolling — until it happens again.
Why it broke — buried, systemic, the thing to change.
- PM interval too long for the route's duty cycle
- A cheaper part brand failing early across a batch
- A procedure step skipped in the shop
- A design or spec mismatch for the operating conditions
Fixing this is what makes the failure actually stop.
The classic tool for getting from one to the other is simply asking "why" until you run out of answers — the alternator failed, why, the belt was loose, why, the tensioner wasn't checked, why, that step isn't in the PM for this batch, why, the PM interval was set for a lighter duty cycle than these buses actually run. Five whys in, you've moved from a part to a policy — and now you can fix something that stops the failure across every bus like it, not just the one on the lift. The catch is that every one of those "why" answers has to come from evidence, not memory, which is exactly where good failure records come in. Sign up free and start tracing failures to their real cause.
The Root Cause Analysis for Bus Failures Method, Step by Step
Root cause analysis sounds like an engineering exercise, but for a bus shop it's a practical, repeatable investigation any maintenance manager can run. When a failure repeats, work these five steps in order — each one narrows the search until the true cause is cornered.
Confirm the Pattern
Before investigating, prove it's actually recurring. Pull the failure history — how many times, on which buses, over what window. A true pattern (same component, multiple times or multiple buses) is what separates a root-cause problem from a one-off.
Gather the Evidence
Collect every work order for that failure — what was replaced, which part brand, which tech, what the DVIR said, mileage and dates. The pattern in this evidence is what points at the cause; guessing without it just adds another wrong fix.
Ask Why Until You Hit the Cause
Walk the five-whys chain from the symptom down. Each answer must be backed by the evidence, not a hunch. Keep going until you reach something you can actually change — a PM interval, a part spec, a procedure — not just another symptom.
Fix the Cause, Fleet-Wide
Apply the fix everywhere the root cause exists, not just the one bus. If a PM interval was wrong for a duty cycle, change it for every bus on that route. Root cause fixes are only worth the effort when they cover the whole population at risk.
Verify the Failure Stopped
Watch the failure rate for that component after the fix. If recurrences drop to zero over the next interval, the cause is dead. If they don't, you found a contributing factor, not the root — go back to the evidence.
The step shops skip most is the last one. It's tempting to declare victory the moment you make a change, but a root cause isn't confirmed until the failure actually stops recurring. That verification is also what protects you from a subtle trap: fixing a real contributing factor that reduces the failure without eliminating it, and mistaking that partial win for a solved problem. The only proof is the failure rate going to zero and staying there — which means you need to be tracking that rate in the first place. Book a walkthrough to see failure rates tracked before and after a fix.
Where the Evidence Lives: Reading Failure History
Root cause analysis is only as good as the evidence behind it, and for a bus shop that evidence lives in the failure history — the work orders, DVIRs, and repair records you've already been logging. Four kinds of data, read together, are what expose a root cause that any single repair would hide.
Work Order History
The complete repair record per bus and component — what was done, when, and how often. Reading a component's full WO history is what reveals a recurrence that any one ticket looks innocent in.
Parts & Brand Data
Which part number and brand went in each time. A failure that tracks to one brand or one lot is one of the most common root causes — and invisible unless parts usage is logged with the repair.
Inspection & Fault History
DVIR flags and telematics fault codes leading up to each failure. The warning signs that preceded the breakdown often point straight at what's really going wrong before the part lets go.
Failure Rate Over Time
How often a component fails across the fleet, trended. This is both the signal that a root cause exists and the proof, after your fix, that you actually killed it.
The reason this matters is that a root cause almost never shows up in a single record — it shows up in the pattern across many. One alternator failure is a repair; the same alternator across four buses in one batch, all running the cheaper brand, all on the same heavy route, is a root cause announcing itself. That pattern is only visible when the history is complete and searchable, which is why fleets running on paper or disconnected tools tend to fix the same failures for years without ever seeing them for what they are. Metrics like MTBF and MTTR are useful summaries of this history, but the raw records are where the actual investigation happens. Sign up free and put your full failure history to work.
The Analytics Engine Behind Failure Investigation
Root cause analysis for bus failures runs entirely on failure data, which is why analytics and reporting is what makes it practical rather than a once-a-year manual audit. BusCMMS captures the complete history every investigation needs and surfaces the patterns automatically — so finding a root cause is reading your own records, not reconstructing them from scratch.
-
Repeat-Failure Detection
Automatically surfaces components and buses with recurring failures across the fleet — so a pattern that looks like five unrelated repairs shows up as the one root-cause problem it really is.
-
Complete Work Order History
Every repair on every bus and component, searchable in seconds — the evidence base an RCA is built on, without digging through folders or spreadsheets to assemble it.
-
Parts Usage Tracking
Logs which part and brand went into each repair, so a failure that tracks to a specific brand or lot — one of the most common hidden root causes — becomes visible instead of invisible.
-
Telematics Fault Codes
Integrated fault codes and DVIR flags tie the warning signs to the failure, so the evidence trail leading up to a breakdown is part of the record, not lost.
-
Failure-Rate Trending
Trends a component's failure rate over time, giving you both the signal that a root cause exists and the after-the-fix proof that it's gone.
-
PM-Adjustment Linkage
When a root cause is a wrong interval, adjust the PM for every affected bus in one place — so the fix reaches the whole population at risk, not just the bus on the lift.
What makes a purpose-built bus platform matter here is that it already knows the shape of the data — it links a fault code to a component to a work order to a part to a PM schedule, which is exactly the chain an RCA has to walk. On a generic tool or a stack of disconnected systems, you'd rebuild that chain by hand every time, which is why most shops don't. When the whole failure history is connected and one search away, root cause analysis stops being a heroic annual project and becomes something you do the moment a failure repeats. BusCMMS reports fleets holding 95%+ availability once recurring failures are actually eliminated rather than repeated — the payoff that broader breakdown-prevention strategies aim at from the other direction.
A Maintenance Manager's Take
That's root cause analysis in one story: the fix wasn't a better bearing, it was a corrected PM interval — a cause no single repair would ever have revealed. The evidence was sitting in the records all along; it only became an answer when someone read the whole failure history together.
The Bottom Line on Root Cause Analysis for Bus Failures
Root cause analysis for bus failures is what turns a shop that's always fixing into one that actually gets more reliable. A recurring failure is never bad luck — it's a signal that the last repair treated the symptom and left the cause in place. The way out is a repeatable investigation: confirm the failure is truly recurring, gather the evidence from your failure history, ask why until you reach something you can change, fix that cause across every bus it affects, and verify the failure rate drops to zero and stays there. The whole method rests on one thing — complete, connected failure records that let you see the pattern across many repairs instead of one ticket at a time. That's where analytics and reporting stops being a dashboard and becomes the tool that ends a failure for good. Fix the symptom and you'll see the bus again next month; find the root cause and you'll fix it once. The records already hold the answer — root cause analysis is just the discipline of reading them together. Book a walkthrough to see root cause analysis run on a fleet like yours.