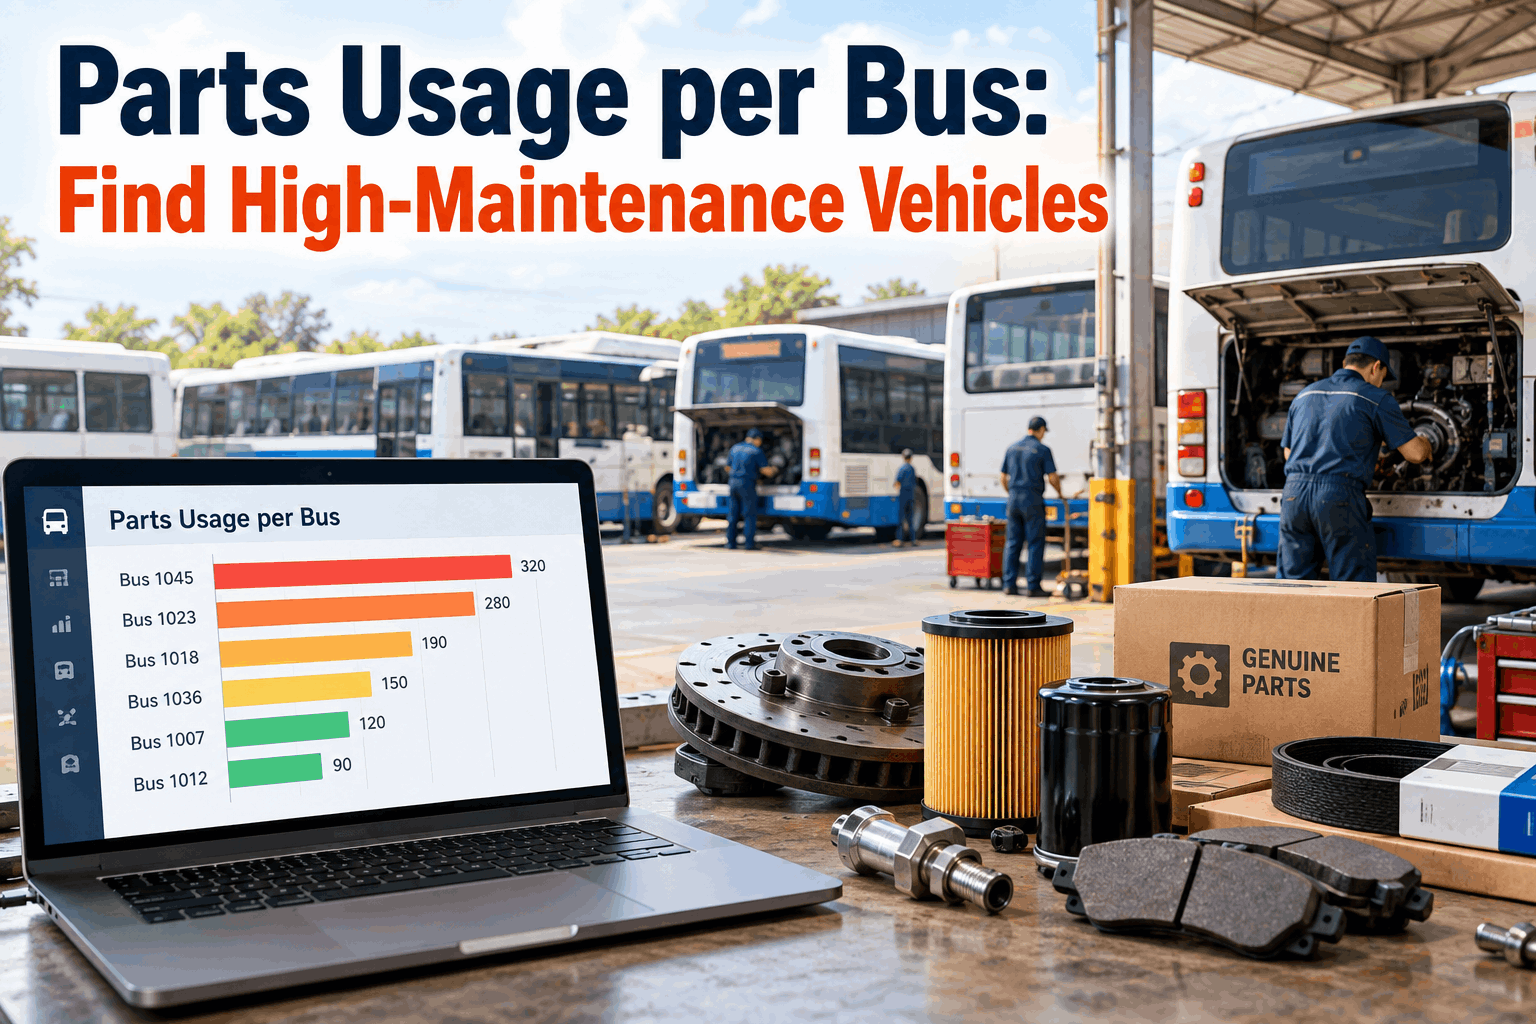
Every fleet has them — the two or three buses that are always in the shop, always needing one more part, always the reason a route runs short. You feel it, but feelings don't get a bus replaced or a root cause fixed. Tracking parts usage per bus turns that gut sense into a ranked list: which specific vehicles are eating parts and repair dollars far above the rest, by how much, and whether it's getting worse. It's how you stop spreading blame across "the fleet" and start naming the buses actually draining the budget.
Parts Usage per Bus: Find Your High-Maintenance Vehicles
Fleet averages hide your worst buses. Rank every vehicle by parts cost and the money-pits jump out — so you can target the fix, the root cause, or the replacement instead of guessing.
Why Fleet Averages Hide Your Worst Buses
The trouble with a fleet-wide maintenance number is that it's an average, and averages hide their extremes. When a handful of money-pit buses gets blended with dozens of healthy ones, the average looks merely "a bit high" — and the specific vehicles causing the damage disappear into the mean. You end up managing a symptom (total spend is up) without ever seeing the cause (these three buses). Tracking parts usage per bus breaks that average back into its parts, and the outliers stop hiding.
The Average Lies
A fleet cost per mile that looks acceptable can hide two buses costing triple the rest. The average tells you the fleet is fine while a few vehicles quietly bleed the budget.
Money-Pits Stay Invisible
Without per-bus data, the vehicle draining parts every week looks like just another bus. You can't act on a problem vehicle you can't single out from the herd.
Replace-or-Keep by Gut
The call to retire a bus gets made on a hunch instead of its true parts-and-repair cost. Without the number, you either keep a lemon too long or replace a bus that was fine.
No Case for the Budget
"Some buses cost a lot" won't win a replacement or a root-cause project. "Bus 214 used $X in parts this year, triple the fleet average" will. Per-bus data is the argument.
This isn't a small effect at the edges — it's often the whole story of a tire or parts budget. BusCMMS has written about how, on a typical fleet, a small fraction of vehicles can drain a wildly outsized share of the maintenance budget — the dynamic laid out in how 15% of buses drain 45% of the budget. If that's true for your fleet, the single most valuable thing you can do is find out exactly which vehicles those are — and that starts with tracking parts usage per bus. Book a demo to see your fleet ranked by parts cost per bus.
What to Track: Parts Usage per Bus, the Right Way
"Parts usage per bus" is more than one number. To find and understand your high-maintenance vehicles, you want a few related measures that together tell you which buses are expensive, why, and whether it's a trend. These four do the job.
Parts Cost per Bus
Total spent on parts for each vehicle over a period, rolled up from every work order. The headline number that ranks your fleet and surfaces the outliers at a glance.
Parts Cost per Mile
Parts cost normalized by miles driven, so a high-mileage bus isn't unfairly flagged. This is the fair comparison — a bus that's expensive per mile is genuinely a problem.
Repeat Parts & Systems
Which parts a bus consumes over and over, and which systems they belong to. A bus burning through the same component points at a root cause, not just bad luck.
Trend Over Time
Whether a bus's parts usage is rising, steady, or falling. A vehicle climbing the ranking month over month is heading toward money-pit status — catch it early.
The normalization point matters most and trips up the most fleets. Raw parts cost per bus will always put your highest-mileage vehicles near the top — but they're supposed to cost more, because they work more. Parts cost per mile is the honest comparison: it separates a bus that's expensive because it's busy from one that's expensive because it's broken. Get both views and the ranking tells the truth. And when a bus tops the list on cost per mile and keeps eating the same part, you're no longer looking at an expensive vehicle — you're looking at a specific, fixable problem, the kind that turns into a targeted cost-per-mile improvement. Sign up free and rank your buses by parts cost per mile.
How to Read the Ranking and Act on It
A ranked list is only useful if it drives a decision. Once your buses are sorted by parts usage, work the outliers in four steps — from spotting them to doing something about them.
Rank and Find the Outliers
Sort every bus by parts cost per mile and look at the top of the list. The vehicles sitting well above the fleet average are your high-maintenance buses — usually a small, obvious group.
Compare Against the Average
Quantify how far above normal each outlier sits — twice the average, triple? The gap is your dollar figure, the exact number that justifies acting on that specific bus.
Diagnose Why It's High
Drill into the outlier's parts history. Is it one recurring system, general old age, or route-driven wear? The pattern tells you whether it's a fixable fault or a fundamentally worn-out bus.
Decide: Fix, Root-Cause, or Retire
If it's one recurring fault, run a root-cause fix. If it's broad old-age decay past the point of return, build the replacement case with the number. Either way, you act on data, not a hunch.
Step three is where per-bus tracking earns its keep, because a high number alone doesn't tell you what to do — the parts history does. A bus that's expensive because it keeps eating alternators is a root-cause project; a bus that's expensive because a little of everything is wearing out at fifteen years old is a replacement candidate. The parts-usage record distinguishes the two, so you don't waste a root-cause investigation on a worn-out bus or scrap a good one over a single fixable fault. That's the difference between reacting to cost and managing it. Book a walkthrough to see an outlier bus drilled down to its parts history.
What a High-Usage Bus Is Actually Telling You
A bus at the top of the ranking isn't a single diagnosis — high parts usage has several possible causes, and the right response depends on which one it is. Reading the parts pattern tells you which. Here's how to interpret what a money-pit bus is really saying.
One Recurring System
The bus keeps eating the same part or system. That's a fixable defect — an alignment issue chewing tires, a fault killing alternators. Run a root-cause fix and the cost drops.
Broad Old-Age Decay
A little of everything is wearing out at once on an aging bus. No single fix helps — this is a vehicle past its economic life, and the parts number is your replacement justification.
Route or Duty Driven
The bus runs the hilliest, hardest route, so it genuinely wears faster. The fix isn't the bus — it's a tougher PM interval for that duty, or rotating the assignment to spread the wear.
The reason this interpretation step matters is that the wrong response to a high-usage bus wastes money in a new way. Root-causing an old-age bus is chasing a problem that has no single fix; scrapping a bus that's only expensive because of its brutal route throws away a good vehicle. Parts usage per bus gets you to the top of the list; reading the pattern gets you to the right action. And because the same data that flags the bus also shows the recurring part, the diagnosis is usually sitting right there in the record — the kind of visibility a full maintenance cost breakdown is built on. Sign up free and turn a high-usage bus into a clear next step.
The Analytics That Surface Your Problem Buses
Tracking parts usage per bus only works if every part used gets attributed to the right vehicle automatically — something a paper log or a shared parts bin can't do. BusCMMS ties every part on every work order to the bus it went on, then rolls it into the rankings and trends that make your high-maintenance vehicles impossible to miss.
-
Parts Cost per Bus Ranking
Roll every part from every work order up to the vehicle and rank the fleet — so the outliers sit at the top of the list instead of hiding in the average.
-
Per-Mile Normalization
Divide parts cost by miles driven so high-mileage buses aren't unfairly flagged — the fair comparison that tells you which buses are truly expensive, not just busy.
-
Trend Tracking
Watch each bus's parts usage over time, so a vehicle climbing toward money-pit status is caught while it's still a cheap intervention — not after it tops the list.
-
Repeat-Parts Detection
Surface which parts a bus consumes again and again, so a high number turns straight into a diagnosis — the recurring system pointing at a fixable root cause.
-
Per-Bus Cost History
Pull any vehicle's full parts-and-repair record on demand — the drill-down that separates a recurring fault from broad old-age decay and drives the fix-or-retire call.
-
Replacement-Case Reports
Turn a bus's cost profile into a board-ready number, so "retire this vehicle" is backed by exactly how much it's costing versus the fleet — a case that gets approved.
The reason a purpose-built bus platform matters here is attribution: the whole method collapses if parts get logged to a generic bucket instead of the specific bus. When a tech pulls an alternator, it has to land against that vehicle's record automatically, or the ranking is guesswork. Because BusCMMS captures parts on the work order and ties them to the bus as part of normal shop flow, the per-bus picture builds itself — you pull a ranking, not assemble one from receipts. That's what lets a manager point at a screen and say "these two buses, this much, here's why" — and it's typically live in two to four weeks. BusCMMS reports fleets meaningfully cutting maintenance cost once the worst vehicles are identified and dealt with.
A Maintenance Manager's Take
That's parts usage per bus doing its job: it named the two vehicles, and the parts pattern told him which was a fixable fault and which was a replacement. The suspicion was right all along — the data just turned it into two correct decisions instead of two guesses.
The Bottom Line on Parts Usage per Bus
Tracking parts usage per bus is how you stop managing your fleet as an average and start managing the specific vehicles that drive the cost. Fleet-wide numbers hide their extremes, so the two or three money-pit buses draining an outsized share of the budget stay invisible until you break the average back into its parts. Track the right measures — parts cost per bus, parts cost per mile for a fair comparison, repeat parts to spot a root cause, and the trend to catch a bus on the way up — then work the outliers: rank them, quantify the gap above average, diagnose why each is high, and decide whether it's a recurring fault to root-cause, an old-age bus to replace, or a hard route to adjust for. The number gets you to the right vehicles; the parts pattern gets you to the right action, so you never root-cause a worn-out bus or scrap a good one over a fixable fault. None of it works without automatic per-bus attribution of every part, which is exactly what a purpose-built system provides and a shared parts bin can't. Do it, and the vaguely expensive fleet becomes a short, named list of vehicles you can actually act on — with the numbers to back every call. Book a walkthrough to find your high-maintenance buses on real data.