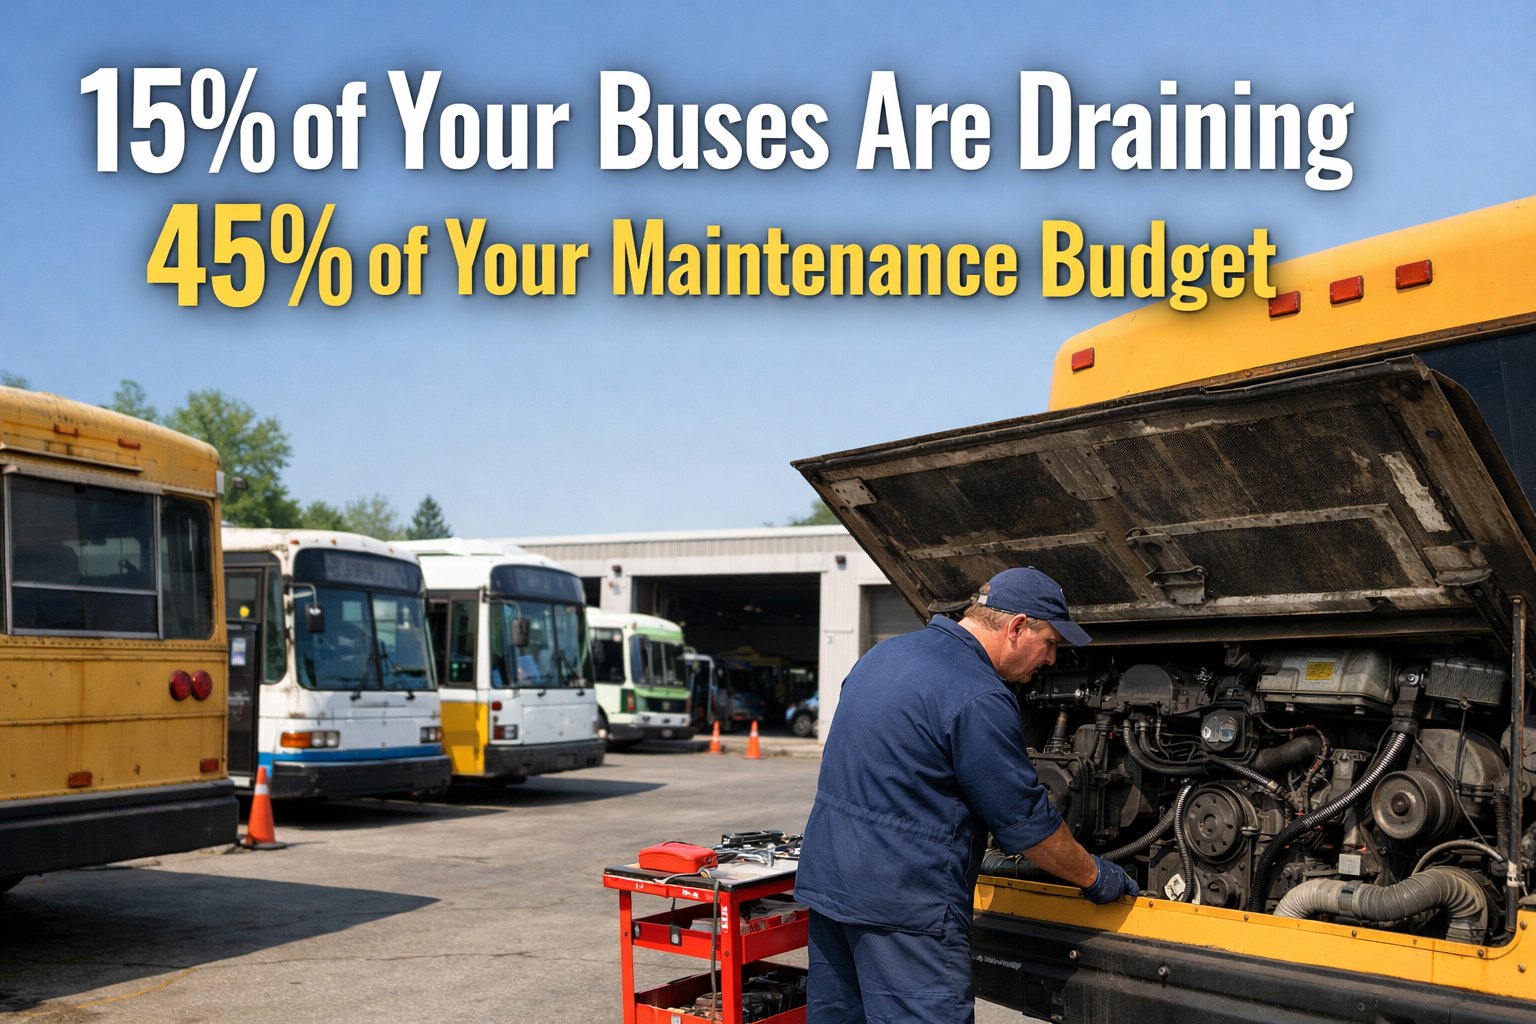
You have 40 buses. Your maintenance budget is $800,000. And somewhere in that fleet, six buses are quietly consuming $360,000 of it — nearly half — while the other 34 vehicles share the rest. You probably know which buses feel problematic. But without per-vehicle cost data, "feel" doesn't hold up in a budget meeting, and it definitely doesn't help you decide whether to repair or replace. This guide breaks down how the 15% problem happens, how to find your money-pit buses and how fleet managers using CMMS analytics are making those decisions in hours, not months.
Why the 15% Problem Is Nearly Invisible Without Data
Most fleet managers track maintenance by total spend — monthly invoices, parts orders, labor hours. That aggregate view hides the most important signal: which specific vehicle is responsible for each dollar. When Bus #14 needs a $4,200 transmission repair in March, a $1,800 cooling system job in June, and two roadcall tows in September, those costs scatter across different work orders, different months, and sometimes different budget line items. No single number screams "problem." But the running 12-month total for Bus #14 tells a very different story.
This is the core of what maintenance professionals call the Pareto effect in fleet management — a small number of assets driving a disproportionate share of total cost. And in bus fleets, the distribution tends to be even more extreme than the classic 80/20 split. Start tracking per-vehicle costs in BusCMMS and find your fleet's money-pit buses.
The 3 Patterns That Create Money-Pit Buses
Money-pit buses don't appear overnight. They follow predictable patterns — and once you know what to look for, the data makes them obvious.
How to Find Your Money-Pit Buses: A 4-Step Framework
This is the exact process fleet managers use to surface cost outliers. With a CMMS, this takes about two hours. With paper records, budget a week — and accept a margin of error.
This four-step process requires clean, per-vehicle data at every stage. Without it, you're estimating — and estimates protect money-pit buses from the decisions they warrant. See how BusCMMS surfaces cost outliers automatically — book a fleet analytics demo.
Expert Review: Manual Tracking vs. CMMS Analytics
Fleet managers who have made the shift from spreadsheet-based tracking to CMMS-driven analytics consistently report the same finding: the data doesn't just confirm what they suspected — it reveals outliers they never would have caught manually.
The operational math is straightforward. If identifying and retiring two money-pit buses saves $60,000 in annual repairs — and those funds shift to PM on the remaining fleet — total fleet reliability improves while total spend decreases. That's not a theory. It's what happens when cost visibility drives decisions instead of gut feel. Create your BusCMMS account and run your first per-vehicle cost report this week.
What Good Cost Data Actually Looks Like
The goal isn't just knowing which buses cost the most — it's knowing why, and what the trend line looks like. Here's the cost profile of a true money-pit bus versus a high-utilization bus that just looks expensive.
Both buses show up as "expensive" in a monthly budget view. Only cost-per-mile analysis reveals that one is an efficient workhorse and one is a budget drain that should have been replaced 18 months ago. Watch how BusCMMS builds this analysis automatically — schedule a 20-minute demo.
Conclusion
The 15% problem isn't a maintenance failure — it's a visibility failure. Most fleet managers are skilled enough to fix the right buses; they simply don't have the data to identify them fast enough or make the replacement case convincingly. Per-vehicle cost tracking, cost-per-mile analysis, and repair frequency mapping are the three tools that turn a $360,000 budget mystery into a clear, defensible action plan. The fleets making data-driven repair-or-replace decisions aren't spending less on maintenance because they're lucky. They're spending less because they can actually see where the money goes. Join them — set up your BusCMMS fleet cost dashboard today.
Frequently Asked Questions
What is the 15% rule in bus fleet maintenance?
In most bus fleets, roughly 15% of vehicles are responsible for approximately 45% of the total maintenance budget. This is a variation of the Pareto Principle applied to fleet assets. These high-cost vehicles — sometimes called "money-pit buses" — consume disproportionate resources due to repeat failures, deferred maintenance cascades, or operating past their economic useful life. Identifying and addressing this 15% typically produces the largest single reduction in fleet maintenance spend.
How do I calculate cost-per-mile for each bus in my fleet?
Cost-per-mile is calculated by dividing total maintenance spend for a vehicle (parts, labor, outside services, emergency tows) by its total revenue miles over the same period — typically a 12- or 24-month window. A vehicle with $18,000 in maintenance that ran 30,000 miles has a cost-per-mile of $0.60. Compare each vehicle's CPM to your fleet average. Any vehicle 20% or more above the fleet average warrants closer review of its repair history by system category.
When does it make more financial sense to replace a bus than repair it?
A common threshold used by fleet managers: if a vehicle's projected annual maintenance cost exceeds 50% of its replacement cost, the financial case for replacement is strong. If a single pending repair exceeds the vehicle's current market value, replacement is almost always the better decision. For example, a bus worth $9,000 on the resale market that needs a $10,500 transmission replacement should be retired — not repaired. The key is having accurate per-vehicle cost data to make this comparison objectively rather than anecdotally.
What repair patterns indicate a money-pit bus?
Three patterns are most reliable: (1) The repeat failure loop — the same vehicle system fails three or more times within 12 months, indicating a structural problem that individual repairs cannot resolve. (2) The cascade effect — a rapid increase in distinct repair categories year-over-year, suggesting one deferred repair is triggering failures in connected systems. (3) The low-mileage cost trap — a vehicle with low annual utilization generating maintenance costs at rates comparable to or exceeding high-mileage vehicles, indicating structural deterioration rather than normal wear.
How does a CMMS help identify high-cost vehicles?
A CMMS captures every work order, parts cost, labor hour, and outside service charge at the vehicle level in real time. This makes it possible to generate per-vehicle cost reports, cost-per-mile trends, and system-level repair frequency analysis instantly — without manual data consolidation. Integrated CMMS platforms like BusCMMS automatically flag vehicles that exceed cost thresholds and generate the data needed to defend repair-or-replace decisions in budget meetings. Agencies using CMMS-driven analytics typically identify their top cost outliers in hours rather than the days or weeks required with spreadsheet-based tracking.