Every spring the same conversation happens: fuel is up, parts are up, driver pay is up, and the transportation line on the district budget is under a microscope. School bus transportation funding has not kept pace with what it actually costs to move students safely and the director who walks into the board meeting with a gut feeling loses to the one who walks in with numbers. If you want to defend next year's transportation budget with cost-per-mile and replacement data instead of estimates, you can see the reports that back a funding request in a demo.
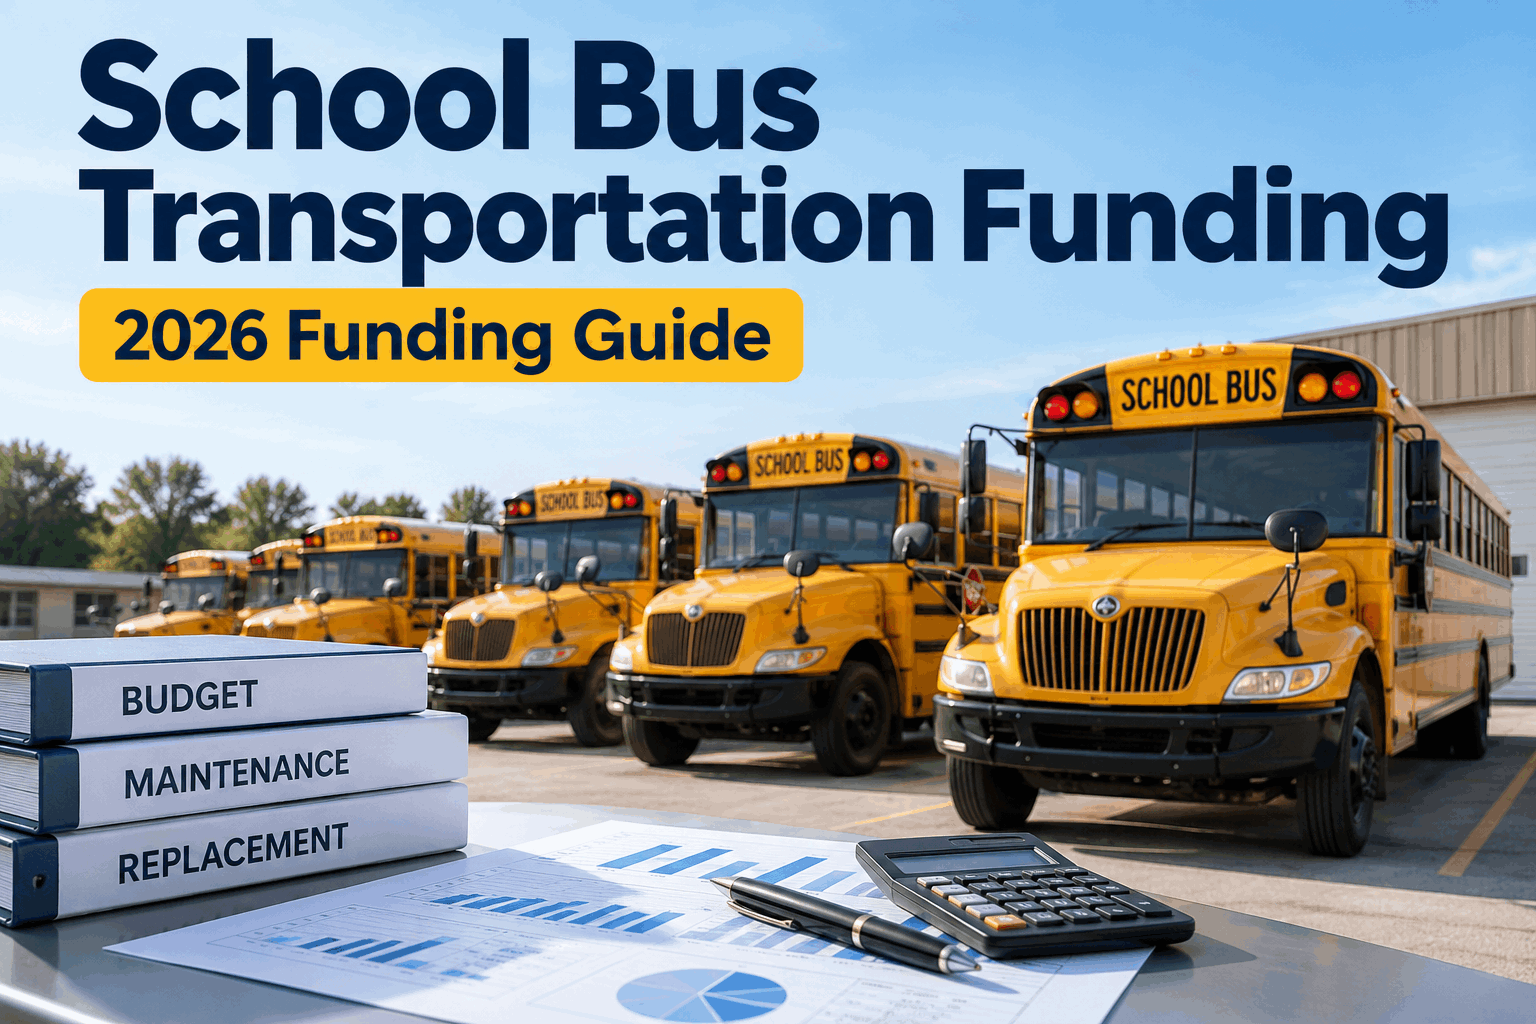
School Bus Transportation Funding: A 2026 Guide to Budgets and Fleet Planning
Where the money comes from, why it is squeezed, and how to turn your own fleet data into a transportation budget your board can approve with confidence.
Why School Transportation Funding Feels Tighter Every Year
Funding formulas move slowly; costs do not. The gap between what a district is allotted for transportation and what it actually spends has been widening, and three pressures are driving it in 2026.
Rising operating costs
Fuel, parts, tires, and insurance all cost more than they did a few years ago, and driver and technician pay has climbed to compete for scarce labor. The same routes simply cost more to run.
Aging fleets, delayed replacement
When replacement funding is tight, buses stay in service longer — and an older fleet costs more to maintain each year, eating the operating budget from the other side.
Flat or lagging formulas
State aid and local allocations are often set on formulas that update slowly and rarely keep pace with real inflation, so the funded amount falls behind the actual cost of service.
When funding lags cost, the districts that protect their budget are the ones that can prove exactly where the money goes — line by line, bus by bus.
Where School Bus Transportation Funding Comes From
Most pupil transportation runs on three sources, and knowing what each one does — and does not — cover is the first step to planning around them. The balance varies by state, but the shape is consistent — and you can see how your own costs map against it in a demo.
Local district budget
Usually the largest shareThe core of day-to-day operating money — drivers, fuel, maintenance, and shop costs typically come out of the district's general or transportation fund, raised largely through local taxes.
Covers: daily operations. Pressure: competes with every other district need.State transportation aid
Formula-drivenMost states reimburse or support pupil transportation through a formula — based on mileage, ridership, routes, or a per-pupil figure. It offsets operating cost but rarely covers it fully, and the formula updates slowly.
Covers: part of operating cost. Pressure: lags real inflation.Targeted federal programs
Program-specific, not operatingFederal money is largely tied to specific purposes rather than general operations — the EPA Clean School Bus Program, for example, put 5 billion dollars over five years (2022-2026, Bipartisan Infrastructure Law) toward cleaner buses. Powerful, but narrow.
Covers: specific initiatives (e.g. EV/clean buses). Pressure: competitive, restricted use.Chasing a clean-bus grant is its own project — we cover that in the Clean School Bus Program grant strategy guide. This page is about funding and planning the whole operation.
Build a Transportation Budget You Can Defend
Whether you are asking for more operating money or protecting what you have, the winning move is the same: show the real cost of service in numbers no one can argue with. These five reports do the heavy lifting.
- Know your true cost per mileThe single most powerful funding number. Total operating cost divided by miles run tells the board what a route actually costs — and whether your funding formula is keeping up.FOUNDATION
- Separate planned vs reactive spendShow how much goes to preventive maintenance versus emergency repairs. A high reactive share is the clearest case for funding that prevents breakdowns rather than paying for them.THE ARGUMENT
- Time replacements with dataTrack cost-per-bus over time to show exactly when a unit crosses from worth-maintaining to worth-replacing — turning a replacement request into a defensible financial decision.CAPITAL CASE
- Prove the ROI of maintenanceTie preventive maintenance spend to fewer road calls and longer service life. Funding that extends a bus three years is cheaper than the replacement it delays — show that math.THE PAYOFF
- Bring one clean report, not a binderBoards fund what they understand. One export with cost-per-mile, spend breakdown, and replacement timing beats a stack of spreadsheets no one reads — and it signals a department in control.DELIVERY
Every one of these comes from data you already generate in daily operations — it just has to be captured and totaled. You can sign up free and start tracking your real cost of service before the next budget cycle.
How BusCMMS Turns Fleet Data Into a Funding Case
A funding request is only as strong as the numbers under it. Because BusCMMS captures every work order, part, and fuel entry as it happens, the reports that justify your budget are a byproduct of running the shop — not a month of spreadsheet archaeology.
Cost-per-mile & cost-per-bus
The core funding metrics, calculated automatically from your own operating data — current, accurate, and ready for the board.
Planned vs reactive breakdown
See the split between preventive and emergency spend — the single clearest argument for maintenance funding.
Replacement-timing & board exports
Per-bus cost trends that pinpoint replacement timing, exported as one clean report for the budget meeting.
BusCMMS reports that districts on its platform cut maintenance costs by roughly 25 to 35 percent in the first year — a company-reported figure from its own customer data, and the kind of saving that stretches a tight transportation budget further. To see it on your fleet, book a demo and bring your budget questions.
A Transportation Director's Take
Key Takeaways on School Bus Transportation Funding
School bus transportation funding is tightening, and no district controls the formulas. What you can control is how well you prove your costs — and that is what wins budget. Four things to carry forward.
Three sources, one gap
Local, state, and federal money rarely keeps up with cost.
Data wins budget
Cost-per-mile beats a narrative every time.
Reactive spend is your case
High emergency cost justifies preventive funding.
Time replacements on data
Per-bus cost trends turn a request into a decision.
You cannot rewrite the funding formula, but you can make the strongest possible case within it. You can sign up free and start measuring your true cost of service — the district that measures its transportation costs precisely is the one that defends its budget and plans its fleet with confidence. School bus transportation funding rewards the departments that can prove their worth in numbers.