A medium-sized transit fleet operating 87 buses and 32 support vehicles struggled to keep its parts stockroom organized while controlling inventory costs. With over 2,500 unique part numbers spanning engine components, brake systems, filters, and electrical parts, the fleet's parts manager relied on a manual spreadsheet that was updated sporadically. Critical items like air filters and brake pads frequently ran out, causing unexpected vehicle downtime and expensive expedited shipping charges. Conversely, slow-moving parts accumulated on shelves, tying up capital and wasting storage space. During a quarterly operations review, the fleet director discovered that 28% of stocked parts had not been used in over 18 months, while 15% of high-use parts were reordered reactively, often after stockouts had already occurred. After implementing a structured min/max inventory management system with automated reorder alerts, the fleet reduced stockouts by 72%, lowered inventory holding costs by 31%, and improved parts availability from 68% to 97%. True inventory efficiency starts with a data‑driven reorder template that sets optimal min/max levels, calculates reorder points based on usage and lead time, and flags slow movers before they become dead stock.
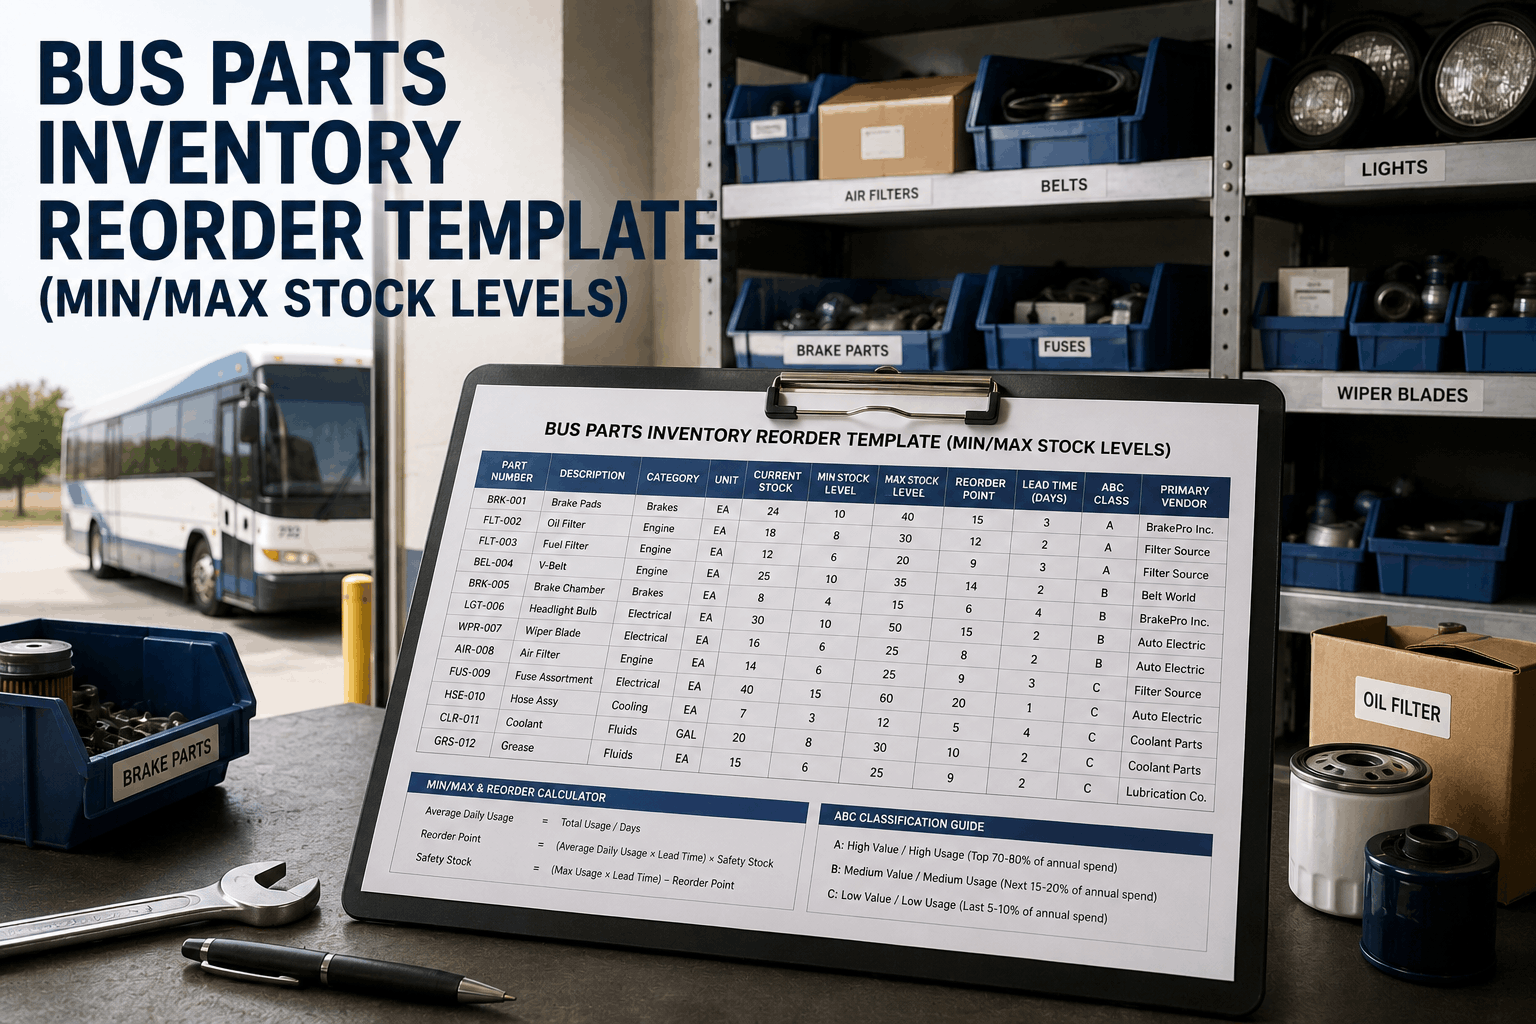
Bus Parts Inventory Reorder Template: Min/Max Stock Levels
Stop reacting to stockouts and overstock. Set data‑driven reorder points, automate replenishment triggers, and optimize your parts room.
Parts Inventory Impact — 87‑Bus Fleet
Stockout Frequency (Monthly)
12–18 stockouts per quarter
Inventory Holding Cost (Annual)
$18,500 – 22% over target
Parts Availability Rate
68% average fill rate
Min/Max Template Implementation
97% parts availability
Stockout Reduction
72% fewer stockouts
Holding Cost Savings
31% cost reduction
The Parts Inventory Challenge: Reactive Reordering vs. Data‑Driven Control
Many fleet operations manage parts inventory with simple spreadsheets that track only current quantities and reorder when shelves look empty. This reactive approach leads to frequent stockouts of fast‑moving items, while slow‑moving parts accumulate and tie up working capital. An effective parts inventory system requires three core data elements: a minimum stock level that triggers a reorder, a maximum level that caps overstock, and a reorder point calculated from daily usage and vendor lead time. A structured template captures these metrics for every part, allowing you to set par levels based on actual consumption patterns, seasonality, and supplier reliability. With this data, you can automate purchase suggestions, prioritize critical items, and reduce both emergency orders and excess inventory.
Manual Spreadsheet Management
Reorder Timing
Ad‑hoc, based on visual inspection or after stockout.
Stock Level Visibility
Only current quantity; no trend or velocity data.
Lead Time Consideration
Rarely factored in; emergency orders common.
Dead Stock Identification
Difficult to spot; parts age on shelves.
Structured Min/Max Reorder Template
Reorder Timing
Automated trigger when quantity hits reorder point.
Stock Level Visibility
Dynamic min, max, and reorder point for every part.
Lead Time Consideration
Built into reorder calculations to prevent gaps.
Dead Stock Identification
ABC analysis highlights slow movers for reduction.
Critical Parts Inventory Metrics to Track
To optimize your parts stocking, your reorder template must track five essential metrics. First: Average Daily Usage—calculated over a rolling 90‑day period to smooth out short‑term spikes. Second: Vendor Lead Time—the average days from order placement to receipt, with buffer for variability. Third: Reorder Point—the quantity at which a new order should be placed, computed as (daily usage × lead time) plus safety stock. Fourth: Minimum Stock Level—the absolute floor that triggers a reorder, typically equal to the reorder point. Fifth: Maximum Stock Level—the ideal upper limit that prevents overstock, often set at 1.5 to 2 times the reorder quantity. With these metrics, your template can automatically flag items approaching the reorder point, suggest order quantities, and identify parts that are consistently under‑ or over‑stocked.
Parts Inventory Performance Benchmarks
Optimal Min/Max Template
Reactive Spreadsheet
Lead Time Accuracy
Dead Stock Reduction
Parts Inventory Template in Action: Real‑World Efficiency Gains
A municipal transit authority with 120 buses and a 3,000‑square‑foot parts warehouse was losing productivity due to frequent stockouts and cluttered shelves. Their inventory spreadsheets listed only current counts, with no reorder triggers. High‑use parts like brake linings and fuel filters were routinely out of stock, forcing mechanics to wait days for deliveries. Conversely, specialized alternators and suspension components occupied valuable bin space with no clear usage pattern. The authority deployed a structured min/max inventory template that incorporated usage history, supplier lead times, and economic order quantities. Within six months, the system automatically suggested replenishment orders, reduced emergency purchases by 68%, and cut overall inventory value by 22% while maintaining a 98% parts fill rate. The parts manager also gained visibility into ABC categories, allowing strategic decisions on which items to stock at higher levels and which to reduce.
Reactive Parts Management
Orders placed after stockout or when shelf appears empty.
No visibility into usage trends or lead times.
Slow movers accumulate, tying up capital and space.
Expedited shipping costs erode budget.
Result: Frequent downtime, high holding costs, and wasted purchasing effort.
Optimized Min/Max Stock Template
Automated reorder alerts based on calculated reorder points.
Historical usage data drives min/max settings for every part.
ABC analysis identifies dead stock for reduction or elimination.
Reduced emergency orders and better negotiated supplier terms.
Result: Improved parts availability, lower costs, and leaner inventory.
Strategic Rollout: 90‑Day Parts Inventory Optimization
Transitioning from a basic spreadsheet to a fully optimized min/max inventory system can be accomplished in three focused phases. Month one: data collection and categorization—gather current quantities, usage history, supplier lead times, and part costs. Classify parts using ABC analysis (A: high‑value, high‑usage; B: moderate; C: low‑value, low‑usage) to prioritize efforts. Month two: set initial min/max levels and reorder points for all stocked items, using the formula (daily usage × lead time) + safety stock. Test the system with high‑volume parts to validate calculations. Month three: implement automated reorder suggestions and integrate with your purchasing workflow. Train staff to interpret reorder alerts and adjust parameters as seasonal demand patterns emerge. This structured approach ensures a smooth transition and immediate visibility into inventory health.
Parts Inventory Template Rollout Timeline
Days 1–30
Days 31–60
Days 61–90
Continuous Optimization
The Bottom Line
Managing bus parts inventory without structured min/max levels and reorder points is a formula for wasted time, money, and vehicle downtime. A data‑driven reorder template transforms your stockroom from a reactive cost center into a proactive efficiency driver. By setting reorder points based on usage patterns and supplier lead times, you eliminate stockouts, reduce excess inventory, and free up working capital. BusCMMS provides the tools to build and maintain a comprehensive parts inventory system, complete with automated reorder alerts, ABC classification, and real‑time stock visibility. This framework ensures your fleet has the right parts at the right time, keeping buses on the road and maintenance costs under control.
Eliminate Stockouts. Reduce Overstock. Optimize Your Parts Room.
Set min/max levels, automate reorder points, and track inventory in real time. Free 14‑day trial.
Frequently Asked Questions
What is a min/max inventory system and why is it important for bus fleets?
A min/max system sets a minimum stock level that triggers a reorder and a maximum cap to prevent overstock. It ensures you always have critical parts on hand without tying up excess capital, reducing downtime and holding costs.
How do I calculate the reorder point for a bus part?
Reorder point = (average daily usage × supplier lead time in days) + safety stock. The template automates this calculation using your historical usage data and vendor lead times.
What is ABC analysis and how does it help with parts inventory?
ABC analysis categorizes parts by annual usage value: A items (high value/usage) require tight control, B items (moderate) need regular monitoring, and C items (low) can be stocked with looser limits. This helps prioritize management effort and optimize stock levels.
How often should min/max levels be reviewed?
It's best to review settings quarterly or whenever usage patterns change significantly (e.g., seasonal shifts, fleet expansion, or new routes). The template can track usage trends and suggest adjustments.
Can the template handle parts with long lead times from multiple suppliers?
Yes. You can enter lead times per supplier, and the template will calculate reorder points accordingly. It can also suggest preferred suppliers based on reliability and cost.
How does the system alert me when a part needs reordering?
Once you set min/max levels, the system generates automatic reorder suggestions when stock hits the reorder point, showing the recommended order quantity based on your maximum level and current inventory.
Transform Your Parts Room Into a Data‑Driven Inventory Hub.
Set min/max levels, automate reorder points, and keep your fleet moving. Free 14‑day trial.