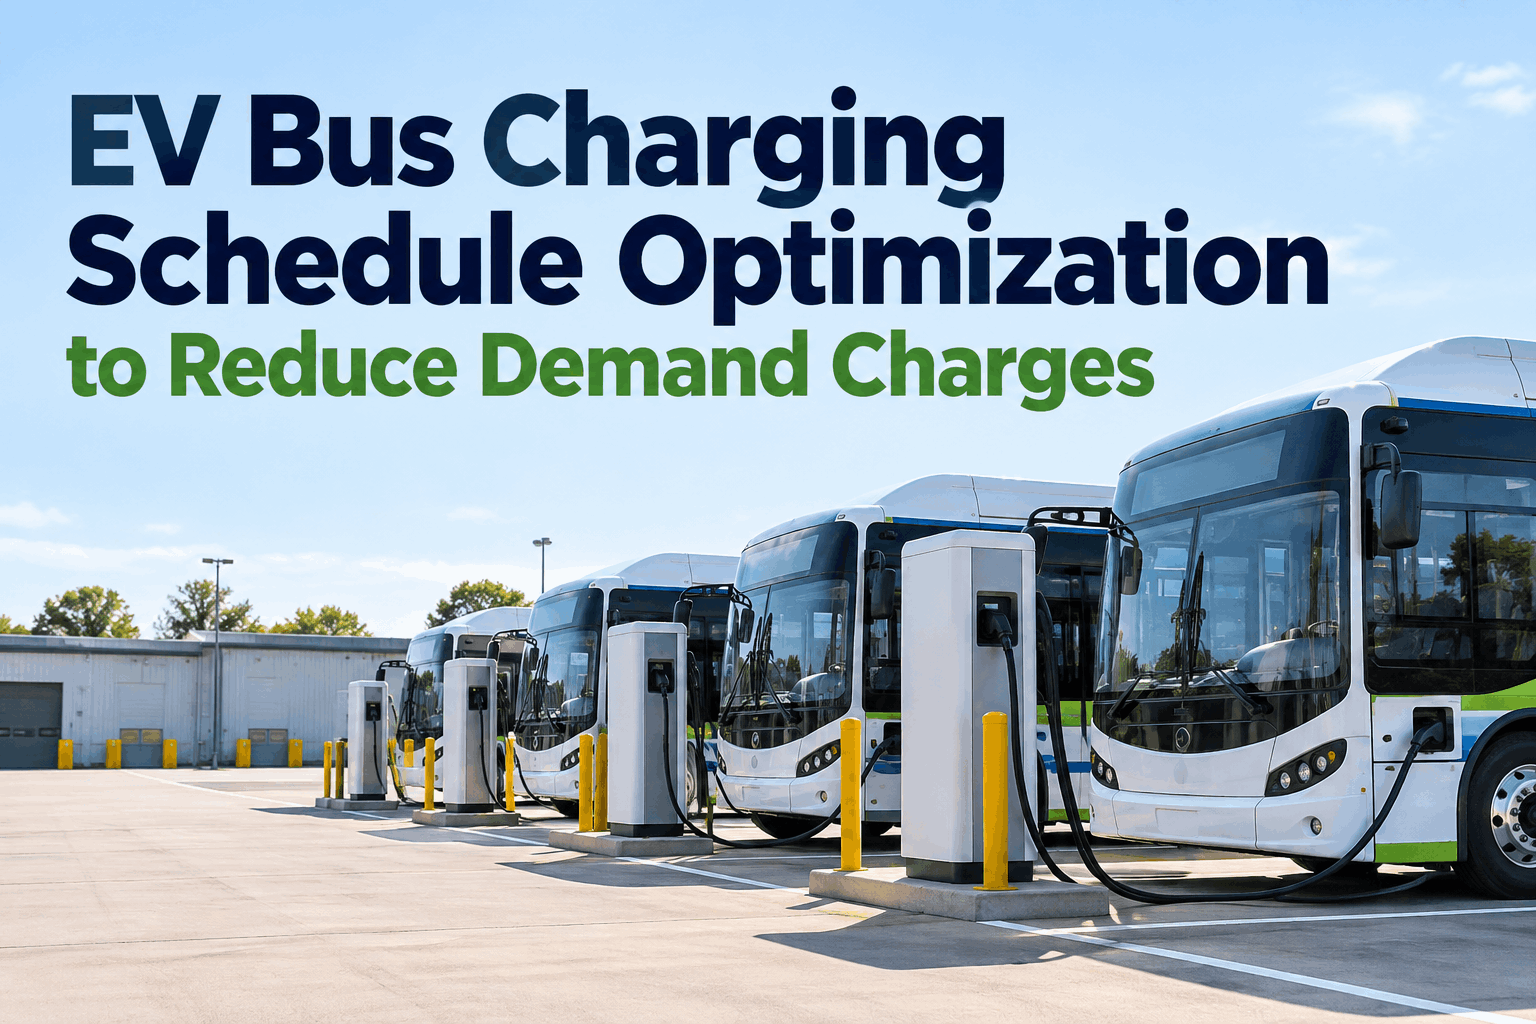
Electric bus fleet operations fundamentally depend on depot charging infrastructure strategy. Unlike diesel buses refueling at commercial stations in 5-10 minutes, electric buses require structured charging planning coordinating charger capacity, grid demand management, scheduling, and power delivery timing. Effective charging strategy determines fleet operational efficiency, energy costs, and infrastructure investment return. In 2026, depot charging infrastructure represents 15-25% of total electric bus fleet acquisition cost, requiring careful planning to optimize infrastructure utilization and minimize operational disruptions. This comprehensive guide examines depot charging infrastructure design, charger technology selection, load management strategies, charging scheduling, grid demand coordination, and operational optimization for electric bus fleets. Understanding charging infrastructure requirements, power management systems, and fleet scheduling enables fleet managers to maximize operational efficiency while minimizing energy costs. BusCMMS fleet management software integrates charging scheduling, grid load forecasting, and energy optimization enabling sophisticated charging strategy execution across complex multi-bus operations.
Electric Bus Charging Strategy 2026
Complete depot charging guide covering charger sizing, load management, scheduling optimization, grid coordination, and energy cost reduction for electric bus fleet operations.
Charger Power Levels (kW)
Charging Time (300 kWh Battery)
Infrastructure Cost per Charger
1 Depot Charging Infrastructure Planning: Charger Types and Technology Selection
Understanding charger power levels enables optimal infrastructure selection: Electric bus charging infrastructure operates at multiple power levels suited to different operational scenarios. Opportunity chargers operate at 30-50 kW providing supplemental charging during brief mid-route stops (10-15 minutes) extending range for afternoon/evening routes. These lightweight chargers mount on poles, occupy minimal space, and cost $30,000-$50,000 installed. Depot slow chargers operate at 50-80 kW providing extended charging during overnight 8-10 hour layovers. These chargers fully charge 300 kWh batteries during overnight parking using standard facility electrical infrastructure. Depot slow chargers cost $50,000-$100,000 installed and represent baseline charging infrastructure for most fleets. Depot fast chargers operate at 150-350 kW providing rapid charging during mid-day turnarounds (2-3 hours), enabling buses to complete afternoon/evening routes after limited mid-day charging. Depot fast chargers cost $150,000-$250,000 installed due to complex power distribution and thermal management requirements. Ultra-fast chargers exceeding 450 kW provide 1-hour charging enabling express route service or increased utilization. Ultra-fast chargers cost $200,000-$350,000 installed and require substantial facility electrical upgrades.
Charger technology variations affect cost, performance, and operational flexibility: Plug-in pantograph systems mechanically align charging couplers above buses reducing manual handling and enabling rapid charging cycles. Plug-in systems cost 10-15% more than cable-based systems but deliver superior durability and faster turnaround times. Cable-based systems require operator connection/disconnection adding 2-3 minutes per charging cycle but enable flexible parking and reduce infrastructure footprint. Wireless/induction charging eliminates physical connections enabling charging during bus movement through charging zones embedded in depot floors or route corridors. Wireless charging remains experimental in 2026 with significant cost premium ($500,000+), limited fleet compatibility, and unproven long-term reliability. Most deployments prioritize proven plug-in pantograph or cable-based systems.
Charger redundancy and reliability considerations impact operational continuity: A single charging failure can eliminate entire fleet charging capacity if infrastructure is insufficient. Establishing charger redundancy—oversizing infrastructure 15-20% above theoretical need—ensures operational continuity if individual chargers fail. For 50-bus fleet requiring 10 MW daily charging capacity, installing 12-13 MW capacity (20% surplus) enables operational continuity if one major charger fails. Charger redundancy costs additional $250,000-$500,000 per fleet but prevents catastrophic operational failure. Fleet managers should prioritize redundancy, especially for urban transit systems where schedule disruptions impact thousands of passengers daily.
2 Electrical Infrastructure Requirements and Grid Connection Planning
Depot electrical infrastructure must support simultaneous multi-bus charging without grid overload: A 50-bus fleet with 300 kWh batteries operating on 150 kW slow chargers requires 7.5 MW capacity for simultaneous overnight charging. Most depot electrical systems were designed for vehicle maintenance and administrative loads (500 kW-2 MW), not vehicle charging. Grid connection upgrades are necessary for all but smallest electric bus fleets. Utility electrical engineers evaluate existing facility capacity, transformer sizing, distribution lines, and substation capacity. Facilities with existing 10 MW+ capacity might accommodate charging infrastructure with minimal upgrades ($50,000-$200,000). Facilities with 2-5 MW capacity require significant distribution system upgrades ($200,000-$800,000). Facilities with <2 MW capacity require complete substation installation or new utility feed ($500,000-$2,000,000+). Electrical infrastructure costs represent 20-40% of total charging infrastructure investment, requiring early coordination with utility providers during charging strategy planning.
Load management systems optimize electrical demand reducing infrastructure costs and peak charges: Electric utilities charge demand fees based on peak consumption during billing period. A depot pulling 7.5 MW simultaneously faces peak demand charges of $500-$1,500 per kW monthly. For 7.5 MW, monthly demand charges alone reach $3,750-$11,250. Load management systems stagger charging cycles avoiding simultaneous multi-bus charging. Advanced load management enables 7.5 MW demand spread across 12-hour charging window (625 kW average demand) reducing peak charges 90%+. Load management software integrates with BMS systems, utility pricing signals, and renewable energy availability enabling optimal charging timing. Sophisticated load management reduces energy costs $20,000-$50,000 annually for medium fleets (50-100 buses). BusCMMS fleet management includes advanced load management algorithms optimizing charging across diverse fleet compositions and operational schedules.
Renewable energy integration reduces operating costs and supports sustainability goals: Solar installations generating 500 kW-2 MW during daylight hours reduce grid dependency and lower energy costs. For a fleet consuming 1,000-2,000 kWh daily, 1 MW solar generation offset 30-50% of energy consumption on sunny days. Solar installations cost $1,000-$1,500 per kW ($1,000,000-$1,500,000 for 1 MW system) but qualify for 30% federal investment tax credit reducing net cost to $700,000-$1,050,000. Solar installations offset charging costs $15,000-$30,000 annually, achieving 7-10 year payback. Wind resources (if available) provide 24/7 generation capability complementing solar. Combining solar and battery storage enables 80%+ renewable energy penetration in fleet charging.
3 Charging Scheduling and Route Optimization for Maximum Efficiency
Charging schedule planning must account for route profiles, utilization patterns, and turnaround times: Different route types require different charging strategies. Fixed local routes operating 4-6 hours daily require 100-150 mile range, achievable with overnight slow charging. Express routes operating 8-10 hours require 200-300 mile range, necessitating mid-day fast charging to extend range. High-frequency shuttle routes operating 10-12 hours require dual charging: overnight slow charge + mid-day fast charge. Effective charging scheduling starts with route analysis: identify route duration, typical mileage, turnaround times, and range requirements. BusCMMS fleet management analyzes historical route data identifying charging requirements specific to each route type. Scheduling algorithms then assign buses to routes and charging slots optimizing utilization. A single bus assigned to mixed routes (short morning, long afternoon) might require mid-day charging; same bus assigned to consistent local routes requires only overnight charging. Detailed route analysis enables right-sizing charging infrastructure to actual fleet needs rather than conservative over-provisioning.
Depot layout and charging station placement impact operational efficiency: Efficient charging station placement minimizes bus movement and reduces charging connector strain. Stations positioned in bus parking area near dispatch/maintenance enable rapid coupling and disconnection. Overhead pantograph systems eliminate manual cable management improving throughput. Some fleets position 80% of buses in fast-charge capable stalls and 20% in slow-charge stalls. Others use all flexible stalls supporting multiple charger types based on daily needs. Layout optimization can reduce charging cycle times 10-15% and extend charger equipment lifespan by 2-3 years. Physical layout planning should occur early in infrastructure planning, not after chargers are installed.
Opportunity charging mid-route extends range and increases utilization without infrastructure expansion: Opportunity chargers at route endpoints or mid-route stops provide 30-50 minute charges adding 40-80 miles range. Opportunity charging enables single buses to serve multiple longer routes within same day without depot charging. A bus with 250 mile battery range operating 2 sequential 200-mile routes requires depot mid-day charging. Same bus with opportunity charging at route midpoint (30 min charge = 50 miles gained) can complete both routes with only overnight charging. Opportunity charging strategically deployed reduces depot infrastructure burden. However, opportunity charging requires coordination with transit systems and partnership with route endpoints (park-and-rides, transit centers, commercial facilities). Opportunity charging represents 15-25% of total fleet charging in sophisticated electrified systems, reducing depot infrastructure needs 20-30%.
4 Grid Demand Management and Off-Peak Charging Optimization
Time-of-use electricity pricing incentivizes off-peak charging reducing energy costs: Electric utilities offer time-of-use (TOU) rates with cheaper off-peak pricing (11 PM-7 AM) and expensive peak pricing (2-8 PM). Off-peak rates average $0.08-0.12/kWh; peak rates average $0.20-0.35/kWh. A fleet charging 3,000 kWh daily split between peak and off-peak consumes: 2,000 kWh off-peak ($160-$240/day) and 1,000 kWh peak ($200-$350/day) = $360-$590/day energy costs. Shifting all 3,000 kWh to off-peak hours reduces costs to $240-$360/day = $120-$230 daily savings ($43,800-$83,950 annually). Off-peak charging requires sophisticated load management scheduling buses to complete overnight charging during lowest-cost windows. Advanced load management coordinating charging across 50-100 buses achieves 70-80% off-peak charging penetration, realizing $30,000-$70,000 annual energy savings. BusCMMS includes time-of-use optimization automatically scheduling charging to exploit TOU rate advantages.
Demand response programs provide revenue opportunities for fleet operators: Utilities increasingly offer demand response programs paying customers to reduce consumption during peak demand periods. Fleet operators with battery storage or flexible charging schedules can participate: pause charging during peak pricing windows and charge during lower-cost windows. Demand response payments range $20-$100 per kW reduced during peak periods. For a 50-bus fleet with 7.5 MW charging capacity, reducing demand 2 MW during peak 10 hours monthly generates $400-$2,000 monthly revenue ($4,800-$24,000 annually). Demand response revenue offsets charging costs while supporting grid stability. Smart load management systems automatically pause charging when demand response signals arrive, enabling passive participation without operational burden.
Battery storage integration enables vehicle-to-grid applications and peak demand shaving: Large fleet battery packs (3,000+ kWh combined) function as distributed storage assets. Vehicle-to-grid (V2G) technology enables buses to discharge stored energy back to facility or grid during peak demand. A 50-bus fleet with 15 MW total battery capacity can absorb 5-10 MW grid disturbances or peak demand spikes. Fleets with V2G capability qualify for additional grid services payments: reserve margin payments, frequency regulation payments, voltage support payments. Combined demand response and V2G payments might exceed $50,000 annually for medium fleets. V2G technology remains immature in 2026 but deployment accelerates as regulations clarify and equipment standardizes.
5 Charging Cost Analysis and Energy Expense Forecasting
Total depot energy costs include electricity, demand charges, and infrastructure depreciation: A 50-bus fleet consuming 3,000 kWh daily faces annual electricity costs (3,000 kWh × 365 days × $0.14/kWh = $153,000) plus demand charges (7.5 MW peak × $50/kW × 12 months = $45,000) = $198,000 annual energy cost assuming no load management. Off-peak optimization reduces energy cost to $120,000-$140,000 annually; demand response participation adds $5,000-$10,000 annual revenue. Charging infrastructure depreciation (amortized over 15 years) costs $100,000-$250,000 annually depending on installation scale. Total 50-bus fleet charging operational cost reaches $220,000-$390,000 annually ($4,400-$7,800 per bus annually). For comparison, 50-bus diesel fleet fuel costs total $750,000-$1,000,000 annually. Electric bus energy costs remain 60-70% lower than diesel fuel costs, providing substantial operating expense savings justifying infrastructure investment.
Charger utilization rates significantly impact infrastructure cost per charging cycle: Chargers operating 24/7 with multiple charging cycles achieve lower cost per charge than chargers operating 10-12 hours daily. A $200,000 fast charger operating 3 cycles daily (36 cycles monthly) costs $5,556 per cycle. Same charger operating 6 cycles daily costs $2,778 per cycle. High-utilization chargers (operating 10-12 hours, 5-6 cycles daily) achieve cost efficiency; low-utilization chargers (operating 4-6 hours, 2-3 cycles daily) remain expensive. Fleet managers should design infrastructure enabling high charger utilization: positioning chargers to serve multiple route types, enabling both overnight and mid-day charging, and perhaps opening chargers for public EV charging during non-fleet hours. Public charging access generates $30,000-$100,000 annually in public access fees while improving charger utilization economics.
Leasing vs purchasing charger infrastructure impacts cash flow and long-term costs: Charger leasing programs available in 2026 provide turnkey infrastructure solutions: utility installs, operates, and maintains chargers for monthly fees. Leasing costs $5,000-$10,000 per charger monthly ($60,000-$120,000 annually) versus $200,000 capital purchase. Leasing improves cash flow and eliminates maintenance risk but costs 60-80% more over 10-year periods. Equipment purchase achieves lower lifetime cost but requires upfront capital and ongoing maintenance. Many fleets use hybrid approach: purchasing chargers with existing electrical infrastructure and leasing chargers requiring new electrical investments, balancing capital outlay with long-term cost.
"We deployed our first 20-bus electric fleet in 2023 without sophisticated charging strategy—just installed chargers and hoped for the best. Within months, peak demand charges exceeded projections by 40%, and operational scheduling was chaotic. We were essentially charging all buses simultaneously during evenings causing 12+ MW grid pulls costing thousands monthly. After implementing BusCMMS load management and time-of-use optimization, we reduced energy costs 35% and eliminated grid demand violations. Load management shifted charging to overnight off-peak hours, staggered buses across 8-hour charging windows, and coordinated with utility demand response programs. Infrastructure investments were minimal (just software), but savings exceeded $80,000 annually. The lesson was clear: charging strategy technology is as important as charging infrastructure hardware. Sophisticated management transforms infrastructure from expensive burden to cost-effective asset."
6 Charging Infrastructure Deployment Strategies for Phased Fleet Electrification
Phased infrastructure deployment enables cost-effective scaling as fleet electrification expands: Rather than installing full infrastructure for eventual 100-bus fleet, install infrastructure for 10-15 initial buses, then expand in 2-3 year increments. Phase 1 (10 buses): 2 MW charging infrastructure ($500,000-$800,000 including electrical). Phase 2 (year 2-3, +20 buses): additional 4 MW infrastructure ($800,000-$1,200,000). Phase 3 (year 4-5, +30 buses): additional 6 MW infrastructure ($1,200,000-$1,800,000). Total phased deployment costs $2,500,000-$3,800,000 versus $4,000,000-$5,500,000 for upfront full buildout. Phased approach saves $1,500,000+ by avoiding overbuilding infrastructure before fleet growth validates design. Phased deployment also allows optimization based on operational experience: Phase 1 data informs Phase 2 design, Phase 2 data improves Phase 3 planning.
Pilot project success validates charging strategy before full fleet deployment: Initial 10-15 bus deployment provides operational learning: actual charging patterns, grid interaction, energy costs, infrastructure reliability, and driver acceptance. Pilot projects often reveal optimization opportunities: underutilized chargers that can be removed, scheduling conflicts requiring different shift times, or thermal management improvements extending battery life. Successful pilots demonstrate ROI to finance teams and board members accelerating future investment approval. Unsuccessful pilots provide data enabling strategy refinement before larger investments. Many successful electric bus programs credit pilot projects as essential decision points preventing expensive full-scale deployment mistakes.
7 Integration with Maintenance Operations and Facility Planning
Charging infrastructure planning must coordinate with maintenance facility requirements: Maintenance bays require vehicle connectivity for diagnostics, software updates, and repair work. Integrated charging and diagnostics stations eliminate separate connections. Charging infrastructure should position chargers to enable bus movement through maintenance bays without disconnection. Facilities separating charging areas from maintenance areas create bottlenecks and inefficiencies. Optimal design integrates charging, diagnostics, and maintenance in unified facility layout enabling smooth operational flow.
Safety and compliance considerations affect facility design and operations: High-voltage charging systems require safety protocols: personnel certification, equipment grounding, emergency shutdown procedures, and protection against arc flash. Facilities must maintain clearance around chargers, proper signage, and emergency access. NFPA 110 electrical safety standards and OSHA electrical safety requirements govern charging infrastructure. Many jurisdictions require licensed electricians for installation and maintenance. Planning should budget $50,000-$100,000 for safety upgrades, signage, and training programs.
Electric Bus Charging Strategy FAQs
- Choice depends on route types and turnaround times. Local routes (4-6 hours) need overnight slow charging (50 kW). Express routes (8-10 hours) need fast charging (150-250 kW). Short turnaround routes need opportunity charging (30 kW). Most fleets use combination: 70% slow chargers, 20% fast chargers, 10% opportunity chargers.
- Charger equipment costs: slow $50-100K, fast $150-250K, opportunity $30-50K. Electrical infrastructure varies: $50K-$2M depending on grid upgrades needed. 50-bus fleet typically requires $2,000,000-$4,000,000 total infrastructure investment including chargers and electrical work.
- Peak demand charges vary by utility: $25-$150 per kW monthly. A fleet pulling 7.5 MW simultaneously faces $180,000-$1,350,000 annual demand charges. Load management systems reduce peak demand 80-90%, saving $150,000-$1,200,000 annually, making load management software essential for cost control.
- Off-peak rates ($0.08-0.12/kWh) are 60-70% cheaper than peak rates ($0.20-0.35/kWh). Load management scheduling 70-80% of charging during off-peak hours (11 PM-7 AM) reduces energy costs $30,000-$70,000 annually for 50-bus fleets through TOU optimization alone.
- Utility assessment takes 4-8 weeks, design takes 8-12 weeks, electrical work takes 12-24 weeks depending on complexity. Total timeline from initial planning to operational charging facility is 6-12 months. Early coordination with utilities is essential; late-stage discovery of electrical constraints causes significant delays.
- 1 MW solar installation ($1,000,000-$1,500,000) generates 30-50% of fleet daily charging needs on sunny days. After 30% federal tax credit, net cost is $700,000-$1,050,000. Solar offsets $15,000-$30,000 annually with 7-10 year payback. Renewable investment makes sense for fleets with available rooftop/land and long-term operational horizons.
- V2G technology enables buses to discharge batteries back to grid during peak demand, generating revenue. A 50-bus fleet participating in demand response and grid services might earn $50,000 annually. V2G technology remains emerging in 2026; wide deployment expected 2027-2028 as standards and regulations mature.
- Integrate chargers with maintenance facility layout enabling buses to move through bays while connected to charging. Position chargers to serve multiple functional areas. Separate charging from maintenance creates operational inefficiencies. Unified facility design optimizes space utilization and operational flow.