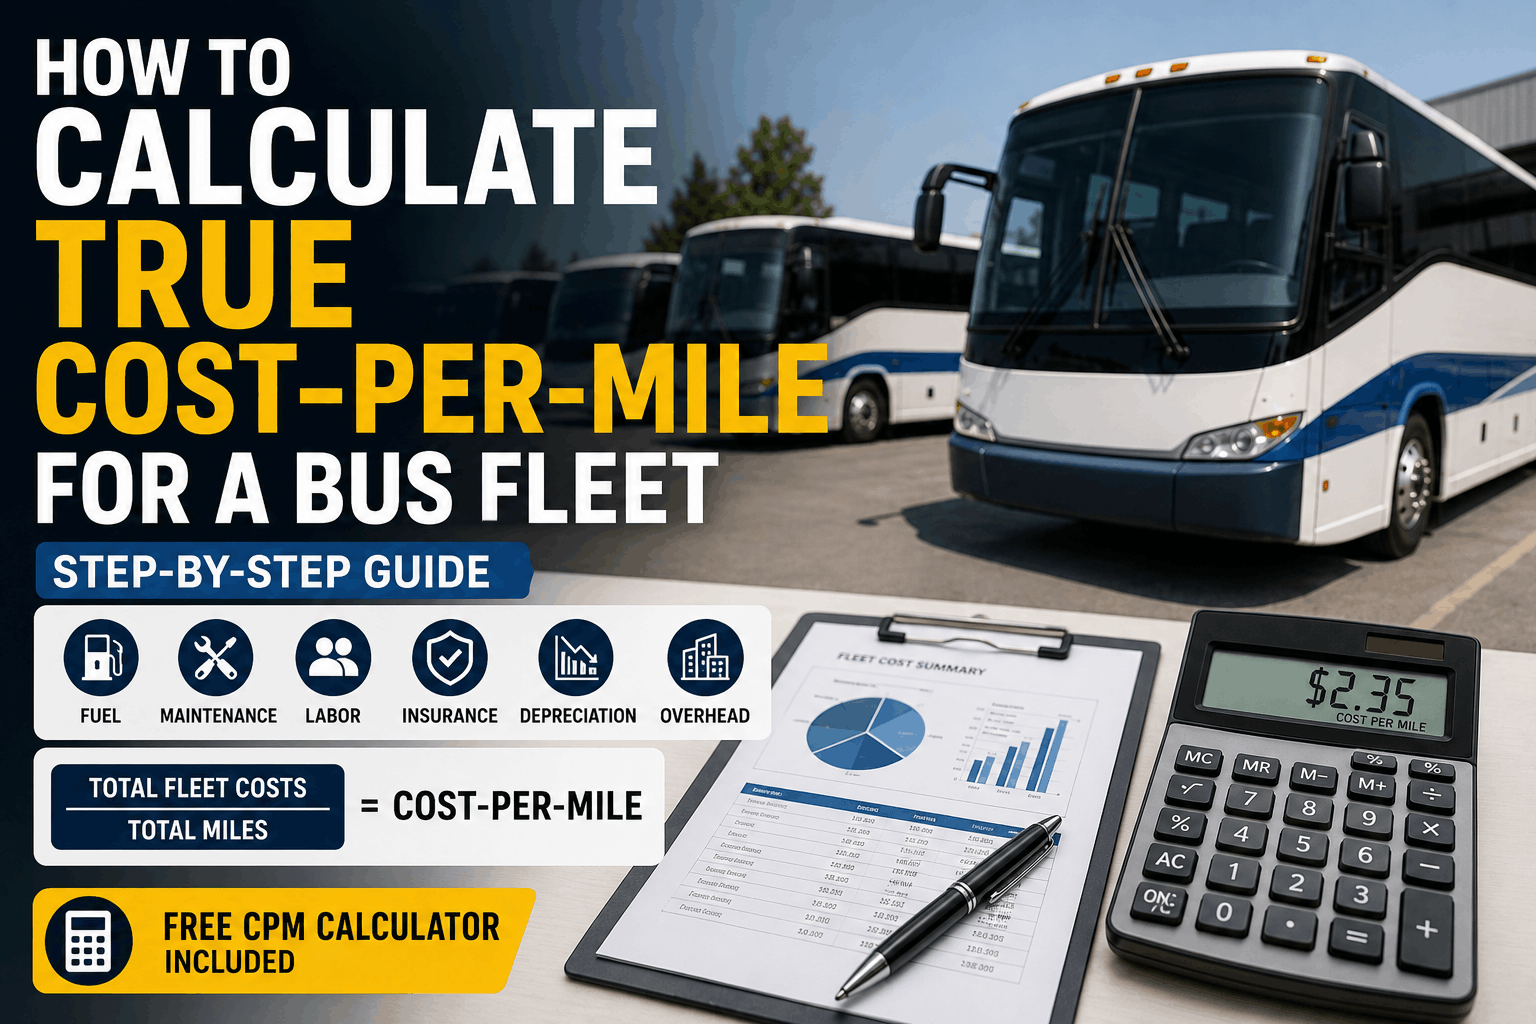
Calculating true cost-per-mile reveals where your fleet spends money and where savings hide. Many operators underestimate total costs by missing depreciation, overhead, and indirect labor. This step-by-step guide walks you through building an accurate CPM calculation that drives smarter budgeting and operational decisions.
How to Calculate True Bus Cost-Per-Mile 2026
How to Calculate True Cost-Per-Mile for a Bus Fleet (Step-by-Step)
Step-by-step guide to calculating true bus cost-per-mile. Direct fuel, maintenance, labor, insurance, depreciation, overhead. Free calculator inside.
Why Your Current Cost-Per-Mile Number Is Probably Wrong
Many fleets only track fuel and direct maintenance, missing 30–50% of true costs. Accurate CPM includes labor, depreciation, insurance, and allocated overhead to give a complete financial picture.
30–50%
Costs missed without full allocation
$1.20–$3.50
Typical true CPM range for buses
18%
Average savings after accurate CPM tracking
2.1x
ROI from CPM-driven decisions
Step-by-Step CPM Calculation Progress
1
Gather All Expense Categories
Identify fuel, maintenance parts, outside repairs, tires, fluids, and all consumables.
2
Add Labor & Benefits
Include mechanic wages, overtime, benefits, and training allocated per vehicle based on work orders.
3
Factor Depreciation & Insurance
Assign annual depreciation per bus and liability/physical damage premiums to get fixed cost per mile.
4
Allocate Overhead Expenses
Distribute facility, utilities, management, and administrative costs across the fleet by mileage.
5
Compute, Compare & Optimize
Divide total annual cost by miles driven. Use BusCMMS to track trends, benchmark, and find savings.
Cost-Per-Mile Breakdown by Category
A typical transit bus costs $1.85 per mile when all categories are included. Fuel alone accounts for 48¢, but maintenance, labor, and depreciation each contribute significantly. Fleets that ignore overhead and depreciation miscalculate CPM by 25% or more.
Fleet CPM Trend After Adopting Full-Cost Tracking
After implementing full-cost tracking, fleets typically see CPM drop from $2.25 to $1.75 over eight quarters. Transparency into labor and overhead costs drives targeted efficiency improvements and smarter procurement.
5 KPIs to Validate Your Cost-Per-Mile Calculation
Track these metrics to ensure your CPM data is complete and actionable:
Total CPM (All-In)
Target: Track monthly per vehicle. Must include all six cost categories to be valid.
Fuel CPM vs. Benchmark
Target: Within 10% of industry average for your vehicle type. High variance signals miscalculation or waste.
Maintenance CPM by Vehicle
Target: Compare across same-model buses. Outliers indicate repair issues or inaccurate work order data.
Labor Allocation Accuracy
Target: 100% of mechanic time assigned to work orders. Unallocated time inflates CPM inaccurately.
CPM Trend Direction
Target: Flat or declining over rolling 12 months. Rising CPM without mileage drop requires immediate investigation.
True CPM Calculation Pass/Fail Checklist
Complete Cost Categories
Pass: Fuel, parts, labor, depreciation, insurance, and overhead are all included.
Fail: Only fuel and direct maintenance are counted, missing 30–50% of true costs.
Accurate Mileage Data
Pass: Odometer or telematics readings verified monthly for every vehicle.
Fail: Estimated or missing mileage causing per-mile rates to be unreliable.
Labor Cost Allocation
Pass: All technician time is tracked against specific buses and work orders.
Fail: Labor lumped into a single pool without vehicle-level assignment.
Depreciation Methodology
Pass: Straight-line depreciation over 12–15 years with residual value considered.
Fail: Ignoring depreciation or using an arbitrary figure not tied to asset value.
Overhead Allocation Logic
Pass: Facilities, admin, and support costs distributed by mileage or vehicle count.
Fail: No overhead allocation, or an arbitrary percentage without basis.
System Integration
Pass: CMMS automatically pulls fuel, maintenance, and labor data into CPM dashboards.
Fail: Manual spreadsheet calculations prone to error and inconsistency.
We thought our CPM was $1.40 until BusCMMS helped us allocate labor, depreciation, and overhead. True cost was $1.98. After tracking all six categories, we reduced it to $1.62 in 18 months through targeted maintenance and fuel efficiency programs. The system's real-time dashboards made cost drivers visible for the first time.
Turn Cost-Per-Mile from a Guess into Your Best Management Tool
BusCMMS automatically calculates true all-in CPM by pulling fuel, parts, labor, and depreciation data into live dashboards. See exactly where your money goes and where to cut.
Cost-Per-Mile Calculation FAQs
What cost categories must be included in true CPM?
Fuel, maintenance parts and labor, tires, outside repairs, depreciation, insurance, and allocated overhead (facilities, administration). Omitting any category understates true cost.
How often should I recalculate cost-per-mile?
Monthly updates provide the most actionable data. BusCMMS recalculates CPM continuously as fuel, parts, and labor transactions are recorded.
What is a good CPM for a school bus vs. transit bus?
School buses typically range from $0.90 to $1.50 per mile, while transit buses range from $1.50 to $3.50 depending on duty cycle and region. Compare within your own fleet first.
How does BusCMMS automate CPM calculation?
BusCMMS integrates fuel card data, parts inventory usage, work order labor hours, and asset depreciation schedules to generate real-time CPM per vehicle and fleet-wide.
Can I allocate overhead without a complicated accounting system?
Yes. A simple allocation by vehicle miles works well. Total overhead cost divided by total fleet miles gives an overhead rate per mile that you add to direct costs.
What is the biggest mistake fleets make with CPM?
Ignoring depreciation and overhead. These fixed costs can represent 25–35% of total CPM but are often omitted because they don't generate a direct invoice monthly.
The Bottom Line
Accurate cost-per-mile is the foundation of fleet financial management. By following the five-step process—gathering all expense categories, adding labor, factoring depreciation and insurance, allocating overhead, and computing total CPM—you get a true picture of operating costs. Fleets that adopt full-cost tracking typically uncover 30–50% hidden expenses and reduce CPM by 18% or more through targeted actions. Use the five KPIs and six-point pass/fail checklist to validate your numbers, and let BusCMMS automate the heavy lifting so every decision is backed by real, complete data.