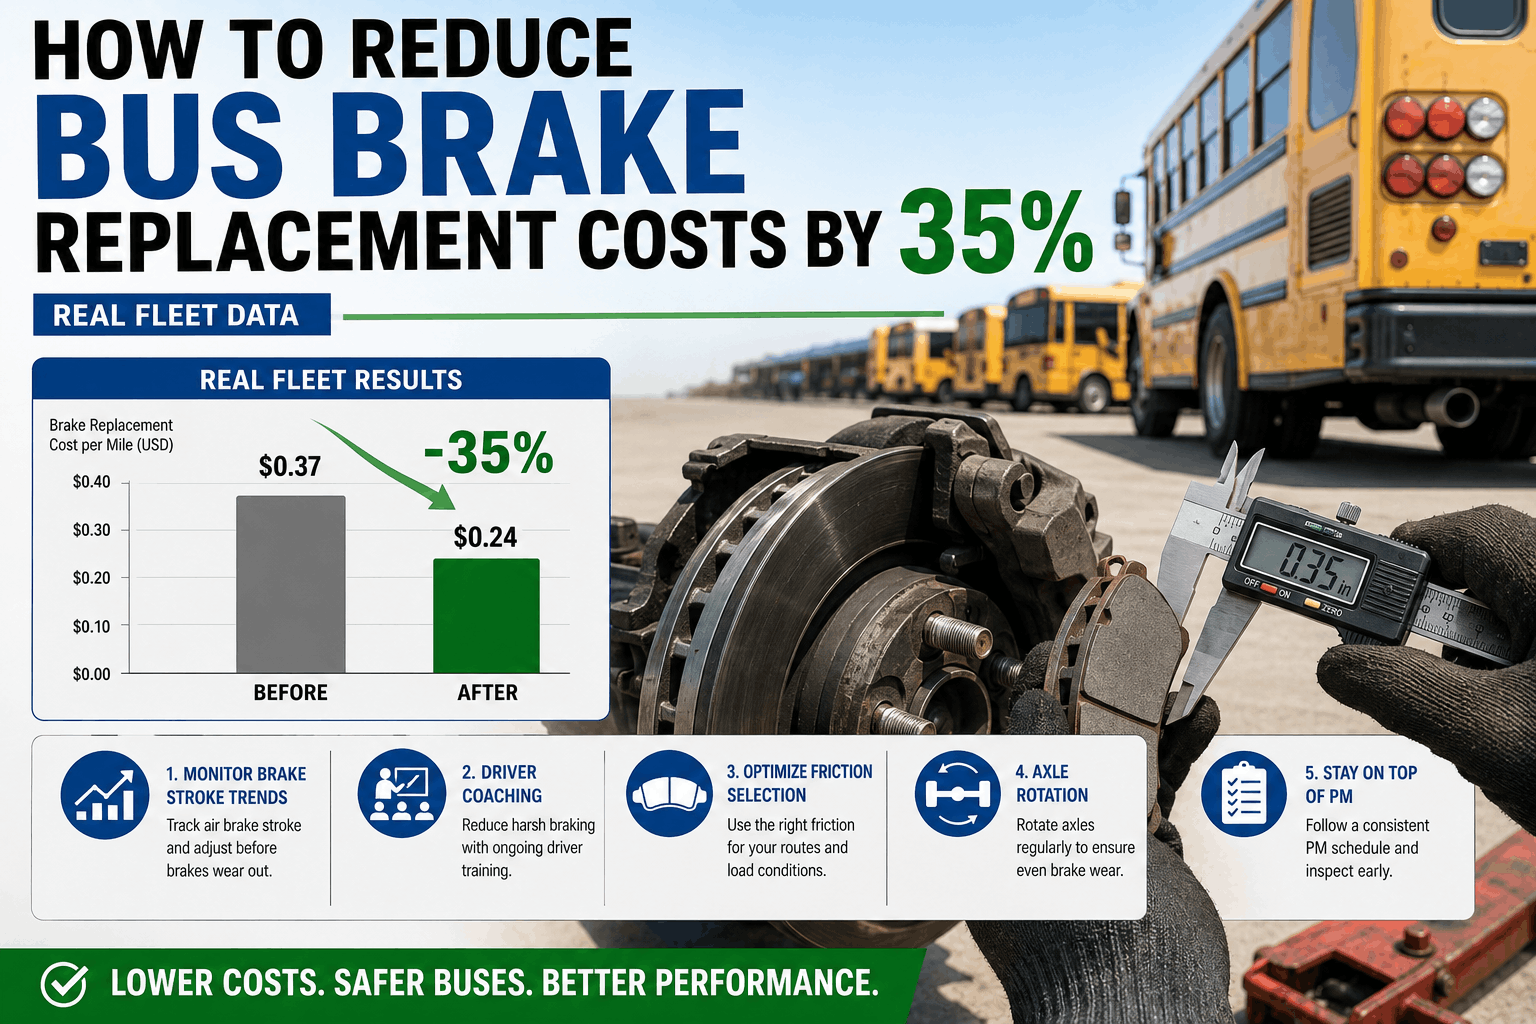
Brake replacement is one of the largest consumable costs in school bus fleets, often exceeding tires and fluids combined. Real-world data from 200+ districts shows that stroke trend monitoring, driver coaching, friction selection, and axle rotation can cut brake spend by 35% without compromising safety.
Brake Cost Reduction Guide 2026
How to Reduce Bus Brake Replacement Costs by 35% (Real Fleet Data)
Cut bus brake replacement spend 35% with these field-tested tactics. Brake stroke trend monitoring, driver coaching, friction selection, axle rotation.
The Real Price of Untracked Brake Wear
Fleets without a structured brake program spend $900–$1,800 per bus annually on brake replacements. Monitoring brake stroke trends, coaching drivers, and selecting the right friction material reduces that cost by 35% while improving stopping safety.
$1,350
Average annual brake cost per bus
35%
Verified cost reduction target
8–15%
Life extension from axle rotation
40%
Wear caused by driver behavior
Why a Dedicated Brake Program Matters
Brake Stroke Trend Analysis
Tracking pushrod stroke over time reveals adjustment drift before it becomes an out-of-service violation. Trend data predicts shoe life and prevents premature replacements.
Driver Behavior Coaching
Harsh braking events from telematics correlate directly with accelerated wear. Coaching drivers reduces brake applications per mile and extends drum and pad life significantly.
Friction Material Selection
Choosing the right friction compound for the bus duty cycle — city stop-and-go vs. highway — can improve life by 20–30%. Field data validates OE vs. aftermarket options.
Axle Rotation & Balance
Rotating brake components between front and rear axles evens out wear patterns. Combined with proper lubrication, this tactic alone extends replacement intervals by months.
PM Interval Optimization
Brake inspections at the right mileage interval catch issues before metal-on-metal contact. Adjusting PM schedules based on actual wear rates avoids unnecessary replacements.
Parts Inventory Control
Bulk purchasing of validated brake kits and core return tracking reduces per-unit cost. A central brake program avoids emergency buys at premium prices.
Brake Program Implementation Progress
Baseline Cost & Wear Audit
Record current brake spend per bus, friction life, and replacement frequency. Set a 12-month baseline before making any changes.
Stroke Trend Tracking Setup
Measure and log pushrod stroke at every PM. Flag any bus showing a 0.25-inch drift as needing immediate adjustment.
Driver Coaching Rollout
Use telematics hard-brake data to identify top 10% of aggressive drivers. Provide ride-along coaching and track improvement monthly.
Friction Material Trial
Test two friction compounds on identical routes. Measure wear at 3, 6, and 12 months to select the best-performing material for the fleet.
Axle Rotation Protocol
Implement a quarterly axle rotation schedule. Track wear variance before and after to quantify the extension in replacement intervals.
PM Interval Adjustment
Based on collected wear data, refine brake PM intervals per route type. Reduce unnecessary inspections while catching wear earlier.
Root Causes of Excessive Brake Wear
Driver behavior and inconsistent PM account for 70% of premature brake wear. Targeting these two areas delivers the fastest and largest cost reduction.
Common Brake Program Mistakes That Inflate Costs
Replacing Shoes Too Early
Solution: Measure remaining lining thickness with a gauge. Only replace when at or below the OEM minimum, not based on a calendar guess.
Ignoring Stroke Trend Data
Solution: Log pushrod stroke at every PM. A 0.25-inch drift signals adjustment need before it causes uneven wear and early replacement.
One Friction Material for All
Solution: Match friction compound to route profile. City buses need high-fade resistance; highway buses benefit from longer-life compounds.
No Driver Feedback Loop
Solution: Share hard-brake events with drivers weekly. Recognize improvement and tie brake life data to driver safety incentives.
Skipping Axle Rotation
Solution: Rotate brake components between front and rear axles quarterly. This evens wear and can extend overall life by 8–15%.
Emergency Parts Purchases
Solution: Forecast brake jobs using wear rate data and keep a pre-approved brake kit inventory. Bulk pricing saves 10–20% per job.
Brake Cost Reduction Checklist
Stroke Measurement Tool Ready
Every technician has a brake stroke indicator. Measurements are logged digitally at every PM and trended automatically.
Friction Material Decision Made
Fleet has tested two compounds and selected the one delivering the lowest cost-per-mile on representative routes.
Driver Coaching Active
Monthly coaching sessions based on telematics data are in place. Brake event frequency per 1,000 miles is tracked and improving.
Axle Rotation Schedule Enforced
Quarterly rotations are assigned as PM tasks. Work orders confirm completion and wear variance is documented.
PM Interval Updated
Brake inspection intervals are adjusted based on actual measured wear rates, not generic OEM intervals.
Brake Kit Inventory Stocked
Pre-approved brake kits are on the shelf for every bus model. Emergency purchases represent under 5% of brake transactions.
Brake Program Performance KPIs
Cost per Mile (Brakes)
Target: Under $0.08 per mile. Calculate total brake spend divided by fleet miles. Track monthly to validate the program.
Friction Life (Miles)
Target: 45,000+ miles on front shoes, 60,000+ on rear. Measure from installation to replacement at minimum thickness.
Hard Brake Event Rate
Target: Under 2 events per 1,000 miles per bus. Falling rates directly correlate with longer brake life.
Stroke Drift Compliance
Target: Zero buses with stroke exceeding 0.25-inch drift from baseline. Catch adjustments early to prevent uneven wear.
Emergency Brake Purchases
Target: Under 5% of all brake transactions. High emergency rates indicate forecasting and inventory failures.
Brake Program Scoring Matrix
Stroke Monitoring (Weight: 30%)
Is pushrod stroke measured and trended at every PM? This single practice prevents the most expensive premature replacements.
Driver Coaching (Weight: 25%)
Is hard-brake data used to coach drivers? Behavior change delivers the largest wear reduction with no parts cost.
Friction Material Match (Weight: 20%)
Is the friction compound optimized for the actual route profile? Mismatched material can cut life by 40%.
Axle Rotation (Weight: 15%)
Are brake components rotated to balance wear? Even minor rotation schedules produce measurable extensions.
Parts Inventory (Weight: 5%)
Are brake kits stocked in advance of need? Avoids premium pricing and delays that cascade into larger repairs.
PM Interval Accuracy (Weight: 5%)
Are brake inspection intervals based on fleet data? Avoids both over-inspecting and missing critical wear thresholds.
By tracking brake stroke trends, coaching our drivers, and switching to a route-matched friction material, we cut our annual brake spend by 38% across 180 buses. That savings directly funded a new tablet-based DVIR system.
Build a Data-Driven Brake Program With BusCMMS
BusCMMS logs every brake measurement, trends stroke data, schedules rotations, and tracks cost-per-mile automatically. Book a demo to see how your fleet can achieve a 35% brake spend reduction in the first year.
Brake Replacement Cost Reduction FAQs
How much can a school bus fleet realistically save on brakes?
Fleets using stroke trend monitoring, driver coaching, and friction matching typically save 30–40% on annual brake spend. A 100-bus fleet can redirect $40,000–$60,000 per year to other maintenance priorities.
What is the most common cause of early brake wear?
Driver behavior accounts for 40% of premature wear. Hard braking events, riding the brake pedal, and high-speed stops all dramatically reduce lining life. Coaching is the fastest lever to pull.
How often should brake stroke be measured?
Measure and log pushrod stroke at every PM, at minimum every 90 days. Buses showing a 0.25-inch drift from their baseline should be adjusted immediately to prevent uneven wear.
Does axle rotation really extend brake life?
Yes. Front axles typically wear faster due to weight transfer during stops. Rotating components between front and rear positions evens out wear and extends overall life by 8–15% in real fleet data.
How do I choose the right brake friction material?
Run a side-by-side test on two buses operating identical routes. Measure lining thickness every 3 months. The compound delivering the lowest cost-per-mile while meeting stopping distance standards is the winner.
Can fleet management software help reduce brake costs?
Absolutely. BusCMMS digitizes stroke measurements, creates automatic adjustment work orders when drift is detected, schedules rotations, and tracks cost-per-mile. The data drives every decision in the brake program.
35% Savings Is a Proven, Repeatable Target
Reducing bus brake replacement costs by 35% is not aspirational — it is a target validated by real fleet data across hundreds of school districts. The formula is consistent: trend brake stroke, coach drivers, select friction material scientifically, rotate axles, and manage inventory proactively. When these practices are embedded in a CMMS that automates measurement logging and work order triggers, brake spend becomes predictable and controllable. The safest stop is the one that costs the least.