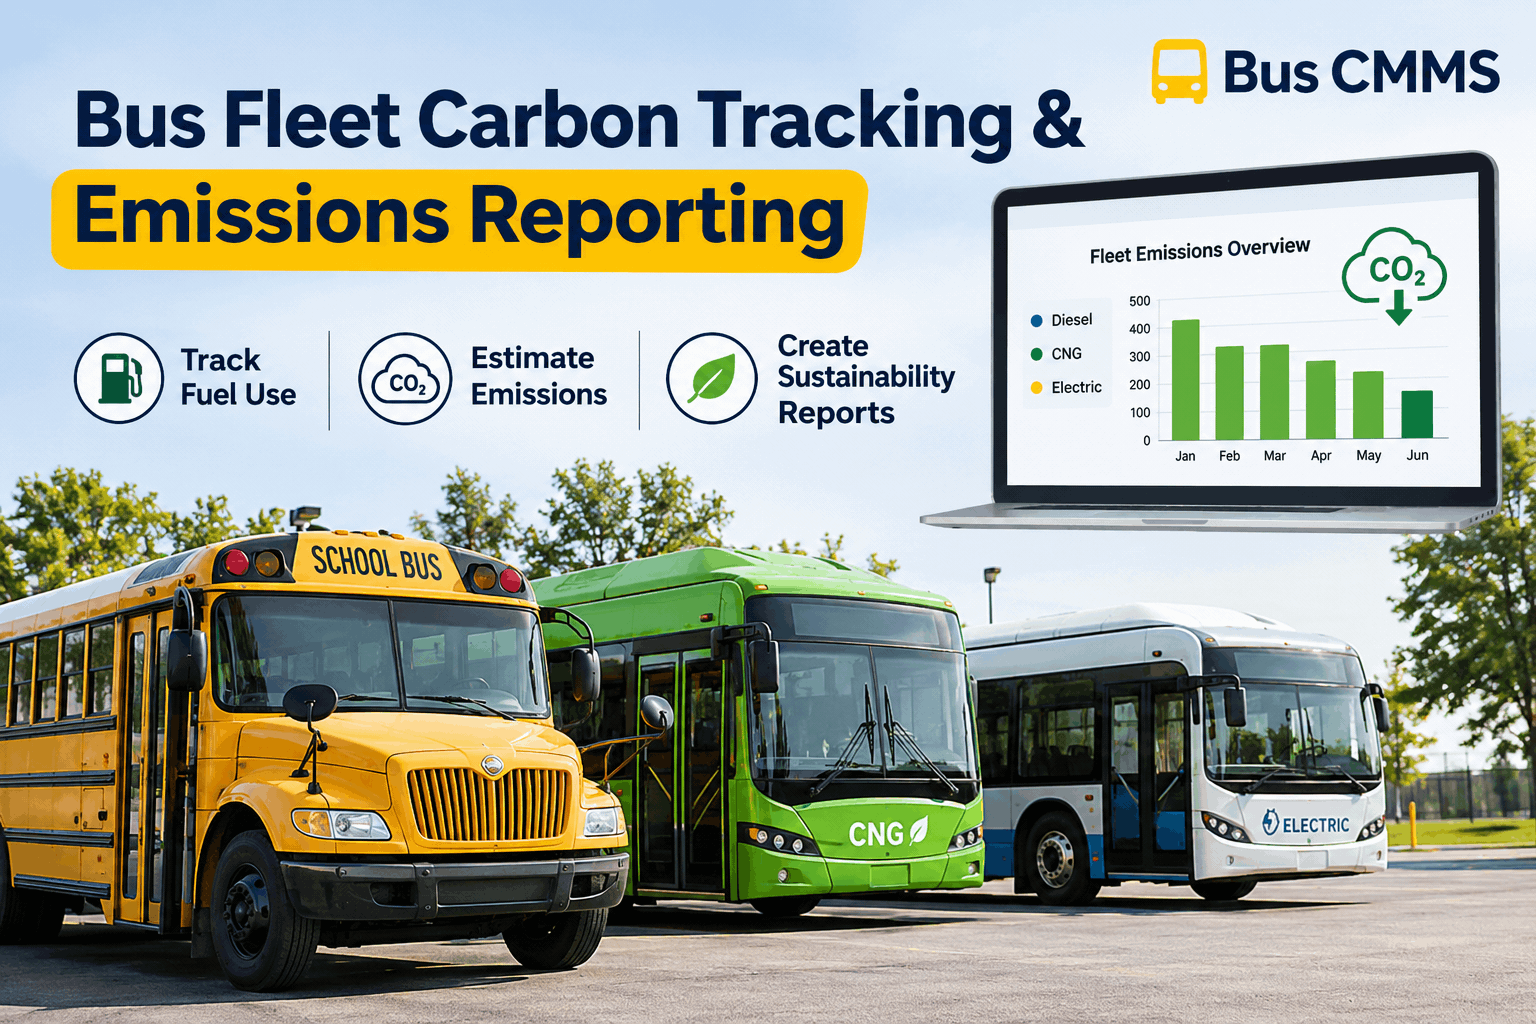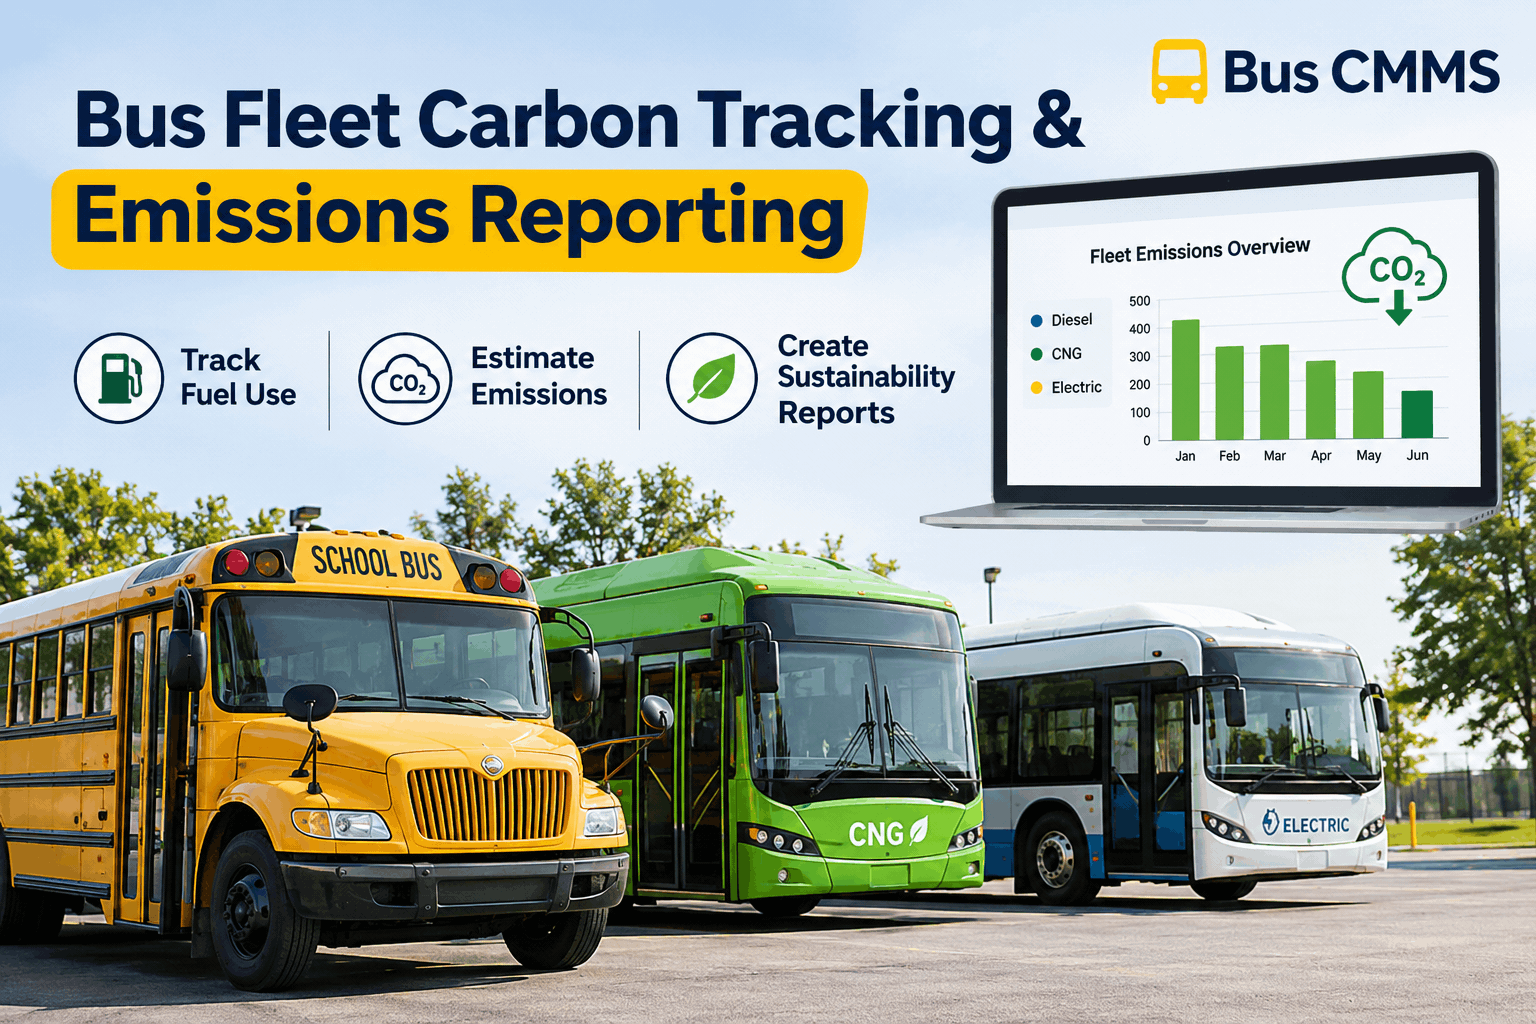
Your fleet runs diesel on the old routes, CNG on a few and a handful of new electric buses on the short loops — and now the board wants a carbon number. The trouble is that one "gallons of fuel" column cannot produce it, because each fuel type carries a different emission factor and comes from a different data source. Bus fleet carbon tracking starts with getting that activity data clean, per fuel type, per bus. You can see your diesel, CNG and electric data tracked in one place in a demo and build the number on solid ground.
Bus Fleet Carbon Tracking Across Diesel, CNG and Electric
A mixed-fuel fleet cannot report emissions from one lumped fuel total. Here is how the carbon math differs by fuel type — and how to organize the data so your sustainability report holds up.
Why One Fuel Total Cannot Carry a Mixed Fleet
Carbon reporting runs on a simple rule: multiply what each vehicle consumed by that fuel's emission factor. The catch is that diesel, CNG and grid electricity each carry a distinct factor and a distinct data source — lumping them into one "fuel" line does not just lose detail, it invalidates the report. And the fuels do not even sit in the same bucket. Plenty of districts and transit agencies now run all three at once — diesel on legacy routes, CNG where the fueling exists, and a growing block of electric buses — which is exactly why a single lumped total quietly produces the wrong number.
A defensible number traces back to a real gallon, a real transaction and a real vehicle — estimates that cannot be traced do not survive a review. You can walk through a mixed-fleet example in a demo to see it mapped out.
The One Calculation, Three Different Inputs
Every fleet carbon figure is the same formula — activity times factor — run once per fuel type and added up. What changes is the unit you track and the factor you apply. Here is the map for a bus fleet.
Swipe sideways to see all columns.
The arithmetic is easy. The hard part — and where reports fall apart — is having clean per-bus, per-fuel-type activity data to put into it. You can see per-fuel-type activity data in a demo built from real fuel records.
Your Carbon-Ready Data Checklist
Before you report a single tonne, your data has to be able to back it up. Run this checklist — every box ticked is a figure an auditor, a board or a grant officer can follow.
-
Fuel tracked by type, never lumped togetherDiesel, CNG and electric each on their own line — the foundation of a valid report.KEY
-
The right unit captured for each fuelGallons for diesel, DGE or therms for CNG, kWh for electric — the factor needs its unit.UNITS
-
Every figure tied to a specific vehiclePer-bus records, so a number traces to a VIN, not a fleet-wide guess.TRACE
-
Scope 1 and Scope 2 kept separateCombustion fuels apart from purchased electricity, so the report is structured correctly.SCOPE
-
Source records kept behind every numberFuel-card transactions and telematics readings retained, so each figure is auditable.EVIDENCE
-
Consistent period-over-period reportingSame method each cycle, so trends are real and progress is provable.TREND
The first and third items — track by fuel type, tie to the vehicle — are where most fleets fall short, and both are a data-capture habit, not a spreadsheet heroics problem. You can see where your carbon data stands in a demo.
How BusCMMS Organizes Mixed-Fuel Data
BusCMMS is built for bus fleets that run more than one fuel type, so the data a carbon report needs is captured as part of normal operations — not rebuilt from receipts at reporting time. It is part of what it does for public transit fleets every day.
Fuel tracking by type, per bus
Diesel, CNG and electric each tracked in their own unit and tied to the vehicle, so every figure traces to a bus.
One dashboard across fuel types
A mixed diesel, CNG and electric fleet managed on a single screen — the same place the fuel-type data lives.
Exportable records with the source behind them
Fuel-card and telematics data retained per bus, so your sustainability report rests on evidence you can show.
BusCMMS organizes the activity data; you apply the emission factors your framework requires — and the number holds up because the data underneath it does. Sign up free and start tracking fuel by type today.
A Transit Fleet Manager's Take
Key Takeaways on Bus Fleet Carbon Tracking
A mixed-fuel fleet can report its carbon credibly — but only on data built for the job. Four things to carry away.
One fuel total will not work
Each fuel type needs its own factor, unit and data source.
Know your scopes
Diesel and CNG are Scope 1; electric charging is Scope 2.
Traceability is the whole game
Every figure must tie to a real gallon, transaction and vehicle.
Clean data, easy report
Capture fuel by type per bus and the carbon number falls out.
Treat bus fleet carbon tracking as a data discipline first and a calculation second, and the emissions report stops being a once-a-year scramble across three systems. The factors are published and the math is simple — the only thing standing between you and a credible number is whether your fuel data was captured cleanly in the first place.