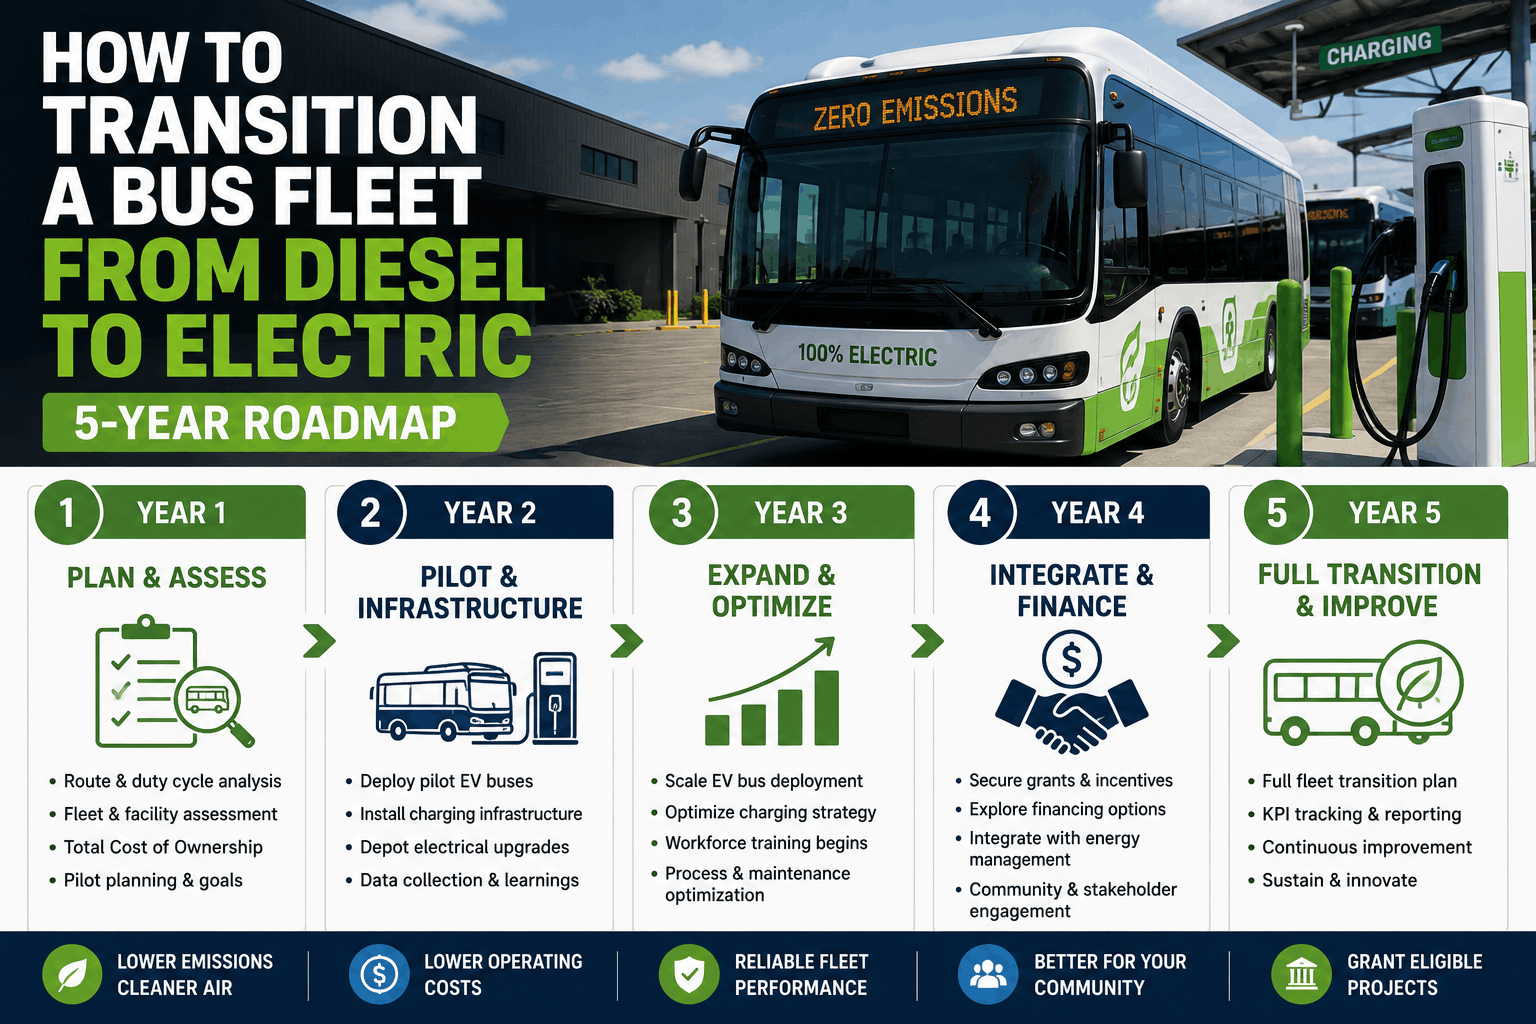
Transitioning a bus fleet from diesel to electric is a multi-year undertaking that requires careful planning around infrastructure, vehicles, training, and funding. This 5-year roadmap provides a phased approach to electrify your fleet while maintaining service reliability, leveraging grants, and achieving long-term operational savings.
How to Transition a Bus Fleet to Electric (5-Year Roadmap 2026)
How to Transition a Bus Fleet from Diesel to Electric (5-Year Roadmap)
5-year roadmap to electrify a bus fleet. Route analysis, infrastructure, depot upgrades, technician training, financing, FTA Low-No grants, KPI tracking.
The Business Case for Bus Electrification
Electric buses offer significantly lower fuel and maintenance costs over their lifetime. While upfront investment is higher, grant programs and operational savings deliver a positive return on investment, often within 6 to 8 years.
60%
Lower fuel cost per mile (electricity vs. diesel)
40%
Reduction in maintenance costs
$1.2M+
FTA Low-No grant per bus available
5 Years
Phased transition to 100% EV fleet
5-Year Electrification Roadmap Progress
1
Year 1: Feasibility & Route Analysis
Conduct energy modeling, identify pilot routes with adequate range, and evaluate depot electrical capacity.
2
Year 2: Infrastructure & Grant Applications
Design charging layout, apply for FTA Low-No and EPA Clean School Bus grants, begin site preparation.
3
Year 3: Pilot Deployment (First 10–20% EVs)
Deploy initial electric buses, train technicians, and validate charging schedules on real routes.
4
Year 4: Scale-Up & Depot Upgrades
Expand charging infrastructure, upgrade transformers, and transition additional routes to electric.
5
Year 5: Full Transition & Optimization
Achieve 100% EV operation, fine-tune charging energy management, and retire remaining diesel buses.
Key Strategies for a Successful EV Transition
Route Suitability Analysis
Critical First Step
Analyze daily mileage, dwell times, and terrain to identify routes that fit current EV range capabilities without schedule disruption.
Charging Infrastructure Planning
Largest Capital Investment
Design a mix of depot overnight charging and on-route opportunity charging to balance cost and operational flexibility.
FTA Low-No & EPA Grant Stacking
Maximizes Federal Funding
Combine multiple grant programs to cover up to 85% of vehicle and infrastructure costs, reducing local financial burden.
Technician EV Training & Certification
Workforce Readiness
Train existing technicians on high-voltage safety, battery diagnostics, and electric drivetrain service well before buses arrive.
Phased Deployment with Data Feedback
De-Risks the Transition
Start with a small pilot, collect real-world energy consumption data, and refine plans before scaling to the full fleet.
Total Savings Breakdown Over 5-Year Transition (50-Bus Fleet)
A 50-bus fleet transitioning to electric can achieve cumulative savings of over $5.4 million through reduced fuel costs, lower maintenance expenses, federal grant support, and avoided downtime. The largest contributors are fuel savings and grant funding.
Fleet Average Cost Per Mile as EV Adoption Increases
As electric bus penetration increases, the blended fleet cost per mile steadily declines due to lower fuel and maintenance expenses. A fully electric fleet can operate at around $1.55 per mile compared to $2.60 for an all-diesel fleet.
5 KPIs to Measure Electrification Success
Track these metrics throughout your transition to ensure you stay on schedule and on budget:
EV Uptime Percentage
Target: 95%+. Measure electric bus availability compared to diesel baseline.
Energy Consumption per Mile
Target: 2.0–2.5 kWh/mile. Monitor efficiency and investigate deviations.
Charger Utilization Rate
Target: 85%+ overnight utilization. Optimize charger deployment to avoid overbuilding.
Grant Fund Capture Rate
Target: 80%+ of eligible costs covered. Track applications and awards against capital spend.
Total Cost per Mile Reduction
Target: 40% decline over 5 years. Validate that operational savings materialize as planned.
Electrification Readiness Pass/Fail Checklist
Route & Range Fit
Pass: At least 60% of routes can be served with current EV range without schedule changes.
Fail: Forcing EVs onto routes that exceed range, causing mid-day charging and delays.
Depot Electrical Capacity
Pass: Sufficient transformer and switchgear capacity for planned chargers with utility commitment.
Fail: Inadequate power supply requiring multi-year infrastructure upgrades before charging can start.
Grant Strategy
Pass: A dedicated grant application plan covering vehicle purchase, chargers, and infrastructure.
Fail: Assuming grants will cover everything without a multi-year application timeline.
Technician Training Plan
Pass: EV safety certification completed for all technicians before first electric bus arrives.
Fail: Scrambling to train staff after buses are delivered, causing maintenance delays.
Fleet Management Integration
Pass: CMMS configured to track EV-specific parameters like battery health, kWh, and charger status.
Fail: Treating EVs exactly like diesel buses in maintenance software, missing critical data.
Stakeholder Communication
Pass: Board, drivers, and community informed about transition timeline, benefits, and temporary disruptions.
Fail: No communication plan leading to resistance, surprise, and operational friction.
We followed this 5-year roadmap with BusCMMS tracking our entire transition. Year 3 pilot with 8 electric buses proved the concept, and now in Year 5, 70% of our fleet is electric. Fuel costs dropped 55%, and maintenance hours per bus decreased by 38%. The system's EV dashboards gave us real-time visibility into battery health and charging efficiency.
Manage Your Entire EV Transition from a Single Platform
BusCMMS supports diesel-to-electric fleet transitions with EV-specific asset tracking, charging infrastructure monitoring, battery health dashboards, and grant management tools. Build your electrification roadmap with data, not guesswork.
Bus Fleet Electrification FAQs
How long does it take to electrify a full bus fleet?
A complete transition typically spans 4 to 7 years, depending on fleet size, funding availability, and utility infrastructure timelines. A phased approach starting with a pilot in year 3 de-risks the process.
What federal grants are available for electric buses?
The FTA Low-No grant program and EPA Clean School Bus Program together provide billions in funding. Many agencies stack multiple grants to cover up to 85% of vehicle and infrastructure costs.
How much do electric buses reduce maintenance costs?
Electric buses typically reduce maintenance costs by 30–45% because they have fewer moving parts, no oil changes, and regenerative braking that extends brake life significantly.
Can existing depots support EV charging?
Most depots require electrical upgrades including transformer replacements and new switchgear. A detailed electrical assessment in Year 1 is critical to avoid delays later.
How does BusCMMS support fleet electrification?
BusCMMS tracks EV-specific KPIs like battery state of health, energy consumption per mile, charger utilization, and maintenance costs. It automates grant reporting and provides electrification dashboards for stakeholders.
What is the biggest risk in transitioning to electric buses?
Insufficient charging infrastructure and power supply delays. These can ground buses even if vehicles are delivered on time. Prioritize utility coordination and depot upgrades early in the roadmap.
The Bottom Line
Transitioning a bus fleet from diesel to electric is a complex but highly rewarding undertaking. Following a structured 5-year roadmap—starting with route analysis, progressing through infrastructure build-out and pilot deployment, and scaling to full electrification—minimizes risk while maximizing the financial and environmental benefits. Fleets that execute this plan can expect a 40% reduction in cost per mile and millions in cumulative savings. Use the five KPIs and six-point pass/fail checklist to keep your program on track, and leverage BusCMMS to manage every aspect of the transition from grant tracking to battery health monitoring, ensuring your electric fleet performs at its best.