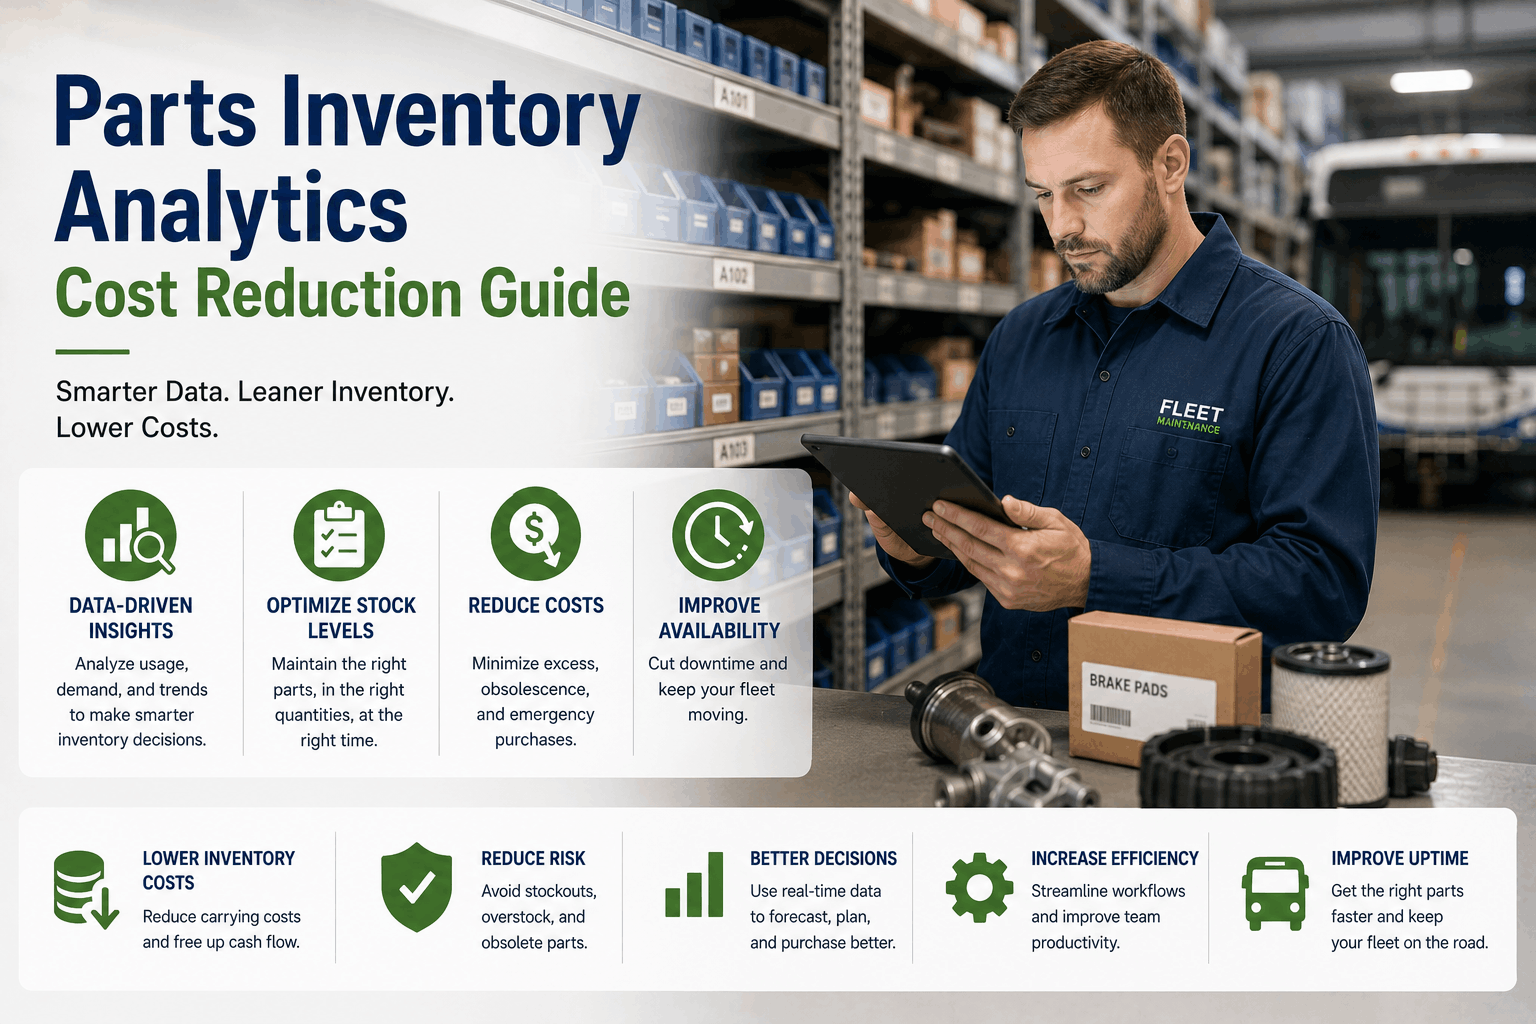
For decades, transit and school bus fleets have treated parts inventory as a necessary evil — stock what you think you'll need, hope you don't run out, and write off the dead stock every few years. This reactive approach ties up millions in carrying costs while simultaneously causing emergency downtime when critical parts aren't available. Modern fleet operations require a different approach: data-driven parts inventory analytics. By analyzing usage patterns, lead times, seasonality, and component failure rates, fleets can optimize stock levels, reduce carrying costs by 20-35%, eliminate stockouts, and free up cash tied up in slow-moving inventory. This guide details the real-world limitations of intuitive inventory management, maps out the key analytics metrics that matter, and provides an actionable blueprint to establish a data-driven parts inventory framework in your maintenance operation.
Parts Inventory Analytics
Parts Inventory Analytics Cost Reduction Guide
Learn practical methods to improve parts inventory analytics, reduce operational risk, and increase fleet reliability with proven maintenance workflows.
Why Intuitive Parts Inventory Management Damages Fleet Budgets
Relying on mechanic intuition or simple "keep one on the shelf" rules for inventory creates major financial blind spots. Without real-time analytics into actual part consumption patterns and lead times, fleet operations lose efficiency in four distinct ways:
Reason 1: Excessive Cash Tied Up in Dead Stock
Parts that haven't moved in 12-24 months represent capital that could be used elsewhere. Typical fleets have 20-30% of inventory value in dead stock — cash sitting on shelves, collecting dust.
Reason 2: Emergency Downtime from Stockouts
When critical parts aren't available, buses sit idle. Rush shipping adds 30-100% to part costs. Lost service revenue compounds the damage. Analytics prevents these stockouts.
Reason 3: Over-Ordering Duplicate Parts
Without usage history, mechanics order parts they think are out of stock — but are already on a shelf in another bin. Duplicate orders waste budget and create excess inventory.
Reason 4: No Visibility into Vendor Performance
Without tracking lead times, fill rates, and pricing trends, fleets can't identify which vendors are reliable or cost-effective. Analytics exposes vendor performance gaps.
The Strategic Analytics Metrics of a Modern Inventory Framework
To build a reliable parts inventory analytics framework, maintenance operations must monitor five core metrics directly tied to cost reduction and availability:
Critical Inventory Metrics vs. Cost Reduction Opportunities
Metric: Inventory Turnover Rate
How many times per year does your inventory sell and get replaced? Low turnover (under 2x annually) indicates dead stock. High turnover (6-12x annually) indicates efficient stocking. Target 4-8 turns for most bus fleet parts.
Metric: Stockout Frequency
How often do mechanics request parts that aren't in stock? Each stockout creates emergency orders (higher cost) and downtime (lost service). Target stockout rate below 2% for critical parts.
Metric: Carrying Cost as Percentage of Inventory Value
Storage space, insurance, taxes, obsolescence, and capital cost. Typical carrying cost is 20-30% of inventory value annually. Reducing inventory by $100,000 saves $20,000-30,000 yearly.
Metric: Dead Stock Percentage
Parts with zero usage in 12+ months. Average fleet has 20-30% dead stock. Each $10,000 in dead stock costs $2,000-3,000 annually in carrying costs alone, plus the tied-up capital.
Metric: Vendor Fill Rate and Lead Time
What percentage of orders ship complete? How long from order to delivery? Poor fill rates force higher safety stock. Long lead times increase reorder points. Track both by vendor.
Metric: Economic Order Quantity (EOQ)
The order quantity that minimizes total inventory costs (ordering + carrying). EOQ balances ordering frequency against carrying costs. Analytics calculates EOQ automatically for every part.
The Playbook: Launching a Data-Driven Parts Inventory Strategy
Transitioning your parts room to analytics-based stocking doesn't have to be overwhelming. Integrate inventory data directly into your centralized CMMS platform with these core steps:
1
Audit Current Inventory and Identify Dead Stock
Conduct a complete physical inventory count. Flag parts with no usage in 12 months. Remove dead stock immediately. Reinvest freed capital into high-turnover parts.
2
Calculate Usage Velocity for Every Part
Use historical work order data to calculate average monthly usage for each part. Segment parts into fast-moving (weekly), medium-moving (monthly), and slow-moving (quarterly+).
3
Set Dynamic Reorder Points Based on Lead Time
Calculate reorder point = (average daily usage × lead time in days) + safety stock. Update as usage patterns change. Never use static reorder points again.
4
Implement Automated Reordering
Configure your CMMS to generate purchase orders automatically when stock falls below reorder point. Eliminate manual ordering delays and missed orders.
5
Track Vendor Performance Metrics
Monitor vendor fill rate, on-time delivery percentage, and pricing competitiveness. Use data to negotiate better terms and select primary vendors.
6
Conduct Quarterly Dead Stock Reviews
Every quarter, review parts with zero usage. Return to vendor, sell, or dispose of dead stock. Adjust stocking policies to prevent future dead stock accumulation.
"Our 150-bus transit fleet had $380,000 in parts inventory. We assumed we needed every part. After implementing inventory analytics through our CMMS, we discovered $95,000 in dead stock — parts that hadn't moved in 18+ months. We also found that we were stocking 6 months of supply for fast-moving filters instead of the optimal 3 weeks. By right-sizing inventory, we freed up $120,000 in cash, reduced carrying costs by $28,000 annually, and actually improved parts availability because we reordered before stockouts occurred. The analytics paid for itself in the first quarter."
— Fleet Maintenance Manager, 150-bus transit system, Florida
ABC Analysis: Prioritizing Inventory Management Effort
Not all parts deserve the same management attention. ABC analysis segments inventory by annual usage value, allowing you to focus effort where it matters most:
A Items (10% of parts, 70-80% of value)
Tires, brake components, alternators, starters, transmissions. High value, high impact. Tight control, frequent review, accurate cycle counting. Reorder point managed daily.
B Items (20% of parts, 15-20% of value)
Belts, hoses, sensors, filters, bulbs. Medium value. Moderate control. Reorder point managed weekly. Cycle count monthly.
C Items (70% of parts, 5-10% of value)
Bolts, nuts, clips, small hardware, consumables. Low value per unit. Loose control. Use min/max with higher safety stock. Cycle count quarterly.
D Items (Obsolete/Dead Stock)
Parts with zero usage in 12+ months. Remove from active inventory. Return, sell, or dispose. Prevent future dead stock through better forecasting.
Reduce Inventory Costs Without Reducing Availability
Parts inventory analytics helps you right-size stock levels, eliminate dead stock, prevent stockouts, and free up cash. Stop guessing. Start optimizing.
Frequently Asked Questions
What is parts inventory analytics?
Parts inventory analytics is the data-driven analysis of usage patterns, lead times, carrying costs, and vendor performance to optimize stock levels, reduce costs, and prevent stockouts.
How much can inventory analytics save my fleet?
Typical savings: 20-35% inventory value reduction through dead stock elimination, 15-25% carrying cost reduction, and stockout elimination. A $500,000 inventory can save $100,000-$150,000.
What is dead stock and how do I identify it?
Dead stock is parts with zero usage in 12+ months. Run a usage report in your CMMS. Flag any part without work order consumption in the past year. Remove from active inventory.
How do I calculate reorder points?
Reorder point = (average daily usage × lead time in days) + safety stock. Example: 2 units/day × 5 days lead time + 5 units safety stock = 15 unit reorder point.
What is ABC analysis in inventory management?
ABC analysis segments parts by annual usage value. A items (10% of parts, 70-80% of value) get tight control. B items get moderate control. C items get loose control.
Does BusCMMS include parts inventory analytics?
Yes. BusCMMS tracks usage velocity, calculates reorder points automatically, generates ABC analysis, flags dead stock, and monitors vendor performance — all in one platform.
Parts Inventory Analytics — Complete Guide
Usage velocity tracking, reorder point optimization, dead stock elimination, ABC analysis, vendor performance monitoring. Everything fleets need to reduce inventory costs.