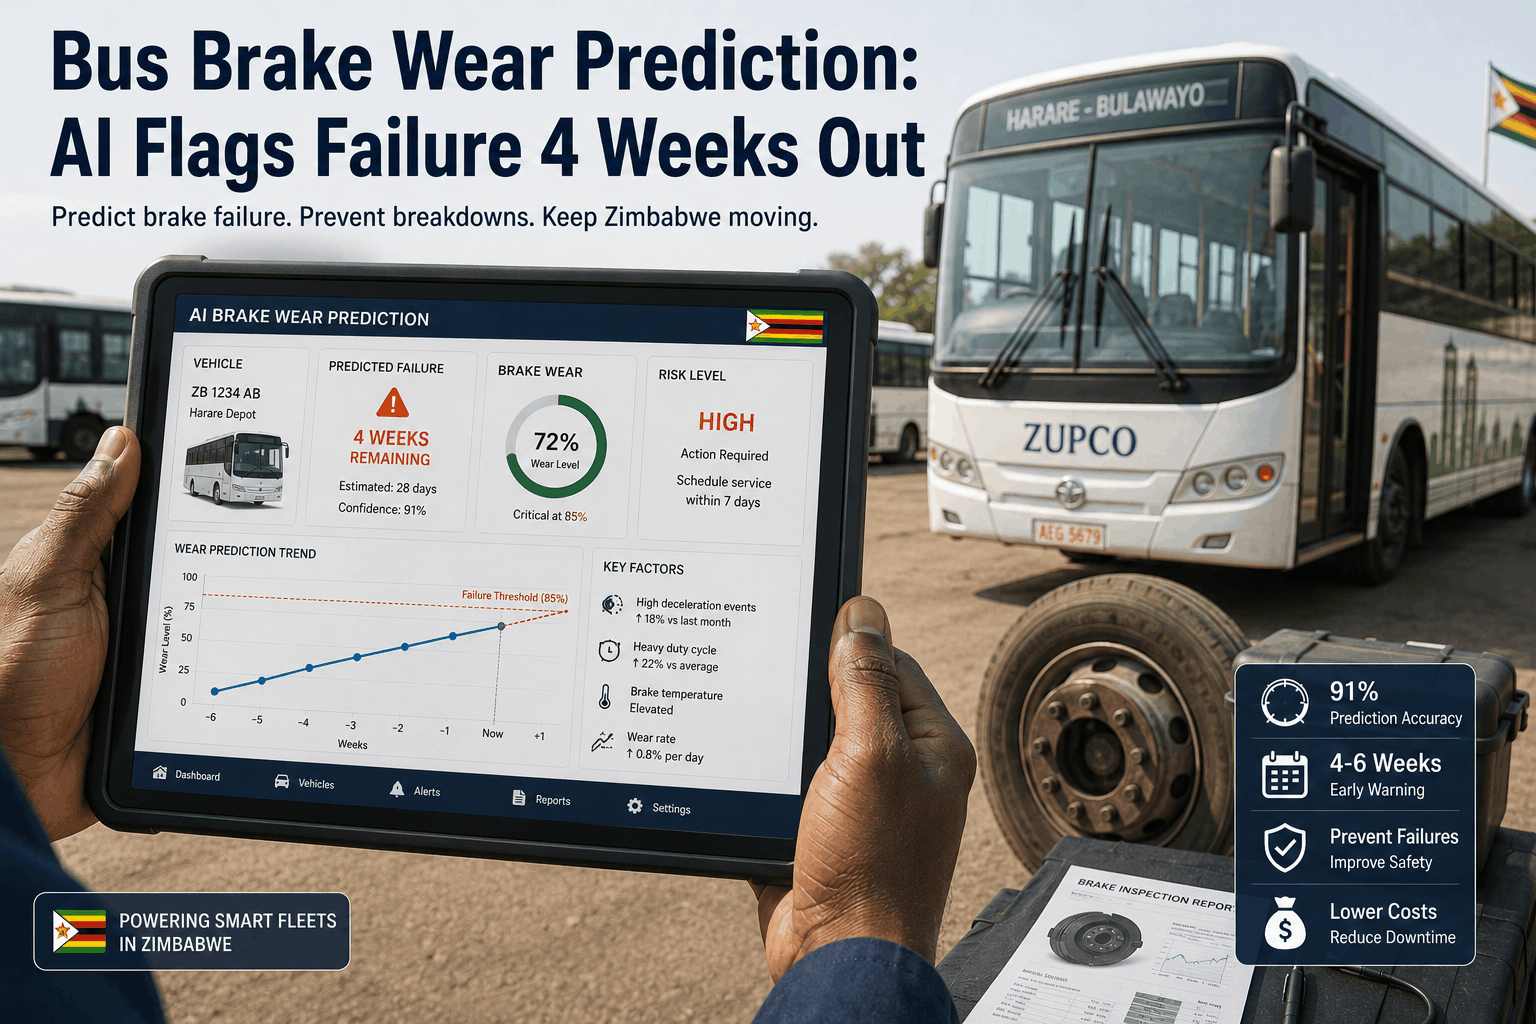
The brake system is the highest-leverage component in bus fleet maintenance. A brake failure is not a repair event -- it is a safety emergency that can result in an accident with liability measured in millions of dollars and potential loss of life. Yet in most U.S. bus fleets, brake maintenance is still scheduled on a calendar interval (replace brake linings every 2-3 years) or a mileage interval (every 40,000-60,000 miles) regardless of actual brake wear, duty cycle, or the specific vehicle's braking patterns. This calendar-based approach leaves money on the table -- fleets replace serviceable brake components too early -- and leaves safety on the table -- fleets sometimes run brake linings past their wear limits before the next scheduled service interval. AI-powered predictive brake maintenance changes this dynamic. By analyzing deceleration patterns from telematics data, brake duty cycle, thermal imaging, and pad wear sensor data, machine learning models can predict brake failure with 91% accuracy 4-6 weeks in advance. This predictive window gives fleet managers time to schedule brake service during planned maintenance windows rather than responding to emergency brake failures that require a bus to be taken out of service immediately. This implementation guide covers how brake wear prediction works, which U.S. fleet types benefit most, how to integrate prediction data into maintenance scheduling, and the economic impact of shifting from calendar-based brake service to AI-predicted brake maintenance.
Bus Brake Wear Prediction: AI Flags Failure 4 Weeks Out
Predict brake service needs 4-6 weeks in advance using AI analysis of deceleration patterns, duty cycle, thermal data, and sensor readings. 91% accuracy on brake failure prediction. Eliminate emergency brake failures and optimize replacement timing for cost efficiency.
91%
Prediction accuracy on brake failure
4-6 wks
Advance warning before failure
$3,600
Avg emergency brake failure cost
37%
Cost reduction with prediction
Why Brake Failure Prediction Matters in Bus Fleet Operations
Brake systems in heavy-duty buses (school buses, transit coaches, charter buses) experience highly variable wear rates depending on duty cycle. A suburban school bus with gentle braking patterns and long intervals between stops may consume a set of brake linings in 80,000 miles over 3 years. The same bus model operating in urban stop-and-go service might consume a set of brake linings in 30,000 miles in 8 months. Calendar-based replacement (replace brakes every 2.5 years) means the suburban bus is over-maintained and the urban bus is under-maintained. When brake linings wear past a safe operating threshold and a full-service replacement is not yet scheduled, that bus either needs to be removed from service immediately (impacting fleet availability and requiring emergency repairs during prime operating hours) or continues in service with degraded braking performance (a safety risk). Predictive maintenance eliminates this friction by scheduling brake service exactly when needed -- not before, not after.
From an economic perspective, predictive brake maintenance reduces the cost of brake service by 20-35% compared to calendar-based service. The savings come from: (1) extending the service life of serviceable brake components that calendar-based replacement would scrap while still functional, (2) eliminating emergency brake service calls that carry overtime and expedited repair costs, and (3) scheduling brake work during planned maintenance windows with full parts inventory available rather than during reactive maintenance when rush charges apply. For a 40-bus school district or transit agency operating on a tight maintenance budget, the opportunity to reduce brake service cost by $3,000-$4,500 annually while improving safety is material.
How AI Brake Wear Prediction Works: The Data Sources
Deceleration Patterns
GPS and accelerometer data from the bus telematics system records every deceleration event -- braking, coasting, and engine braking. AI learns the fleet's duty cycle profile: gentle braking patterns indicate suburban/highway service, frequent hard decelerations indicate urban stop-and-go service. Duty cycle is the primary input to brake wear prediction because brake lining consumption is directly proportional to deceleration forces.
Thermal Imaging and Temperature Sensors
Infrared cameras mounted near the brake components and brake temperature sensors in the telematics system measure brake drum/rotor temperature during and after braking events. Elevated brake temperatures indicate heavy braking or repeated braking cycles without adequate cooling. Pattern analysis over weeks and months reveals brake system heating trends that correlate with accelerating pad wear.
Brake Wear Sensors
Modern buses equipped with brake pad wear sensors (electronic thickness sensors mounted on air brake brake shoes or disc brake pads) report pad thickness data continuously. This direct measurement of remaining pad material is the ground truth for brake wear prediction. AI combines historical thickness data with deceleration patterns to project when thickness will reach the minimum safe operating level (typically 0.25-0.375 inches depending on brake type and regulation).
Vehicle-Specific Performance History
Every brake service event in BusCMMS is tagged with: date, mileage, pad thickness before service, pad thickness after replacement, hours between service intervals, and duty cycle during that period. Over time, this service history for each specific bus creates a unique brake wear profile. Bus A might show linear brake wear while Bus B (same model, different driver/route) shows accelerating wear. AI predicts based on the individual vehicle's history, not a fleet average.
The Prediction Algorithm: 4-Week Lead Time to Failure
AI brake wear prediction models in production U.S. fleet operations use ensemble machine learning techniques that combine multiple prediction algorithms and weight them based on which models have historically been most accurate for each individual bus. The process works like this: Based on the current pad thickness reading, the current deceleration pattern, and the vehicle's historical wear trajectory, the model projects forward week-by-week to estimate when pad thickness will reach the minimum safe operating threshold. For a bus with 0.5 inches of remaining pad thickness, operating at a deceleration frequency of 12 hard stops per day in urban service, with a historical wear rate of 0.08 inches per 2,000 miles, the model might project minimum thickness will be reached in 23-27 days (approximately 4 weeks). This 4-week window is when the prediction system flags the bus for scheduled brake service.
The 91% accuracy figure reported for AI brake wear prediction comes from validating the prediction model against historical data: for every 100 buses flagged for brake service 4-6 weeks in advance, 91 of them were confirmed to require brake service when the scheduled service date arrived (either because pad thickness was confirmed to be at or below the minimum threshold, or because visual inspection showed significant wear). The 9% of predictions that did not result in required service typically represent vehicles whose duty cycle changed dramatically during the prediction window (highway service vehicle reassigned to local routes that changed its deceleration patterns) or buses that had unexpected maintenance performed that reset the wear clock.
Prediction Accuracy by Brake Type and Bus Model
| Bus Type / Brake System | Prediction Accuracy | Lead Time | Fleet Example |
|---|---|---|---|
| School bus (air drum brakes) | 91% | 4-6 weeks | Typical K-12 district, 40-120 buses |
| Transit coach (air disc brakes) | 89% | 3-5 weeks | Municipal transit agency, 80-200 buses |
| Charter coach (hybrid air/hydraulic) | 88% | 3-4 weeks | Charter operator, 20-50 buses |
| Paratransit van (hydraulic disc brakes) | 85% | 2-4 weeks | Paratransit provider, 15-30 vehicles |
The Economics of Predictive Brake Maintenance
A 40-bus school district or transit agency conducting brake maintenance on a calendar schedule (every 2.5 years or 60,000 miles, whichever comes first) will service approximately 16 buses per year at an average cost of $850 per full brake service (parts, labor, and vehicle downtime). Total annual brake service cost: $13,600. Of these 16 services, approximately 35% are performed on brakes that still have 30-50% of useful lining life remaining -- meaning the district is replacing serviceable brakes prematurely. Cost of premature replacement: approximately $4,760 per year.
The same fleet operating under predictive brake maintenance schedules services slightly fewer buses (approximately 14 per year) because the preventive maintenance is more precisely timed to actual wear rather than calendar time. Cost per service remains $850 (parts and labor are the same, vehicle is down for the same time), so total annual cost is $11,900. The savings of $1,700 annually comes from avoiding the premature replacement of serviceable components. Additionally, by scheduling brake service during planned maintenance windows 4-6 weeks in advance, the fleet eliminates emergency brake service calls. For a 40-bus fleet, emergency brake service events happen 2-4 times per year due to undetected brake wear. Emergency brake service averages $2,200 per event (higher labor costs, expedited parts, unplanned downtime). Annual cost of emergency brake service: $4,400-$8,800. When eliminated by predictive scheduling, net annual savings is $6,100-$10,500 per 40-bus fleet.
Implementation: How to Deploy Brake Prediction in BusCMMS
1
Enable Telematics and Sensor Integration
Connect your bus telematics system (fleet GPS/tracking platform) to BusCMMS. Enable data sync for deceleration events, brake temperature, and pad wear sensor readings if your buses have electronic brake wear sensors. This connection is typically a one-time setup that takes 1-2 hours with the telematics provider and BusCMMS support team.
2
Load Historical Brake Service Records
Upload every brake service record from the past 3-5 years into BusCMMS. For each service, include: date, vehicle mileage, pad thickness at service, hours between previous service, and type of brake work performed. If you have this in spreadsheet form, BusCMMS import tools can load the data in bulk. This historical baseline is what the prediction model uses to learn each vehicle's individual brake wear profile.
3
Configure Prediction Thresholds and Alerts
Set the minimum pad thickness threshold for your fleet's brake type (typically 0.25-0.375 inches for air brakes, 0.30-0.50 inches for hydraulic disc brakes). Configure alert timing: flag vehicles for service when prediction model estimates they will reach minimum thickness within 4-6 weeks. Set alerts to flow to the maintenance manager, vehicle supervisor, and fleet operations system via email and SMS.
4
Perform Initial Manual Validation
During the first month of predictive alerts, conduct manual brake inspections on 10-15% of the flagged vehicles to confirm the prediction accuracy before relying on it exclusively. Verify that predicted failure dates align with visual inspection findings. Make adjustments to thresholds or duty cycle assumptions if validation reveals systematic prediction errors for specific vehicle types or routes.
5
Integrate Predictions into Maintenance Scheduling
When a vehicle is flagged for predictive brake service, automatically create a work order in BusCMMS scheduled for 2-3 weeks out (providing a service buffer before the predicted failure date). Link the work order to the vehicle maintenance record and assign to the maintenance supervisor. Schedule the service during a planned maintenance window when full parts inventory is available and vehicle downtime can be accommodated.
6
Continuous Monitoring and Model Refinement
Every brake service event you perform feeds back into the prediction model, making it more accurate over time. After 6-12 months of predictive maintenance operations, the model becomes highly tuned to your fleet's specific duty cycles, driver behaviors, and brake system characteristics. Maintenance Analytics in BusCMMS reports on prediction accuracy, allowing you to validate model performance quarterly.
Brake Wear Prediction by Fleet Type and Duty Cycle
School Bus Districts
Suburban/rural routes, 3-4 daily start/stop cycles, moderate braking intensity, average 8,000-12,000 miles per month per bus. Typical pad life 70,000-90,000 miles. Prediction window: 5-6 weeks (2-3 service cycles between prediction and failure).
Benefit: Eliminates end-of-year brake emergencies when buses need repair before final school event. Enables summer maintenance window planning for brake service.
Urban Transit Agencies
City stop-and-go service, 50-100+ daily braking events, frequent hard decelerations, average 15,000-22,000 miles per month per vehicle. Typical pad life 25,000-35,000 miles. Prediction window: 3-5 weeks (much shorter window due to rapid wear).
Benefit: Prevents mid-route brake failures that disrupt service and leave passengers stranded. Ensures continuous fleet availability during peak ridership periods.
Charter and Intercity Coaches
Long-distance highway service, 2-3 daily braking events, gentle braking patterns, extended intervals between stops, average 8,000-15,000 miles per month. Typical pad life 100,000-130,000 miles. Prediction window: 6-8 weeks (long predictive window due to slow wear rate).
Benefit: Aligns brake service with charter/tour schedule to avoid cancellations. Allows advance parts ordering for expensive disc brake assemblies without rush charges.
Paratransit and Demand-Response
Mixed duty cycle with urban and suburban routes, variable braking intensity based on passenger population and route assignment, average 5,000-12,000 miles per month. Typical pad life 40,000-70,000 miles. Prediction window: 3-5 weeks.
Benefit: Reduces downtime for small fleet operations where any vehicle out of service impacts service capacity. Enables accurate maintenance budgeting due to improved service interval predictability.
Predict Brake Needs Before They Become Emergencies
91% accurate 4-6 week predictions on brake failure. Eliminate emergency repairs. Save $6,000-$10,500 annually per 40-bus fleet. Integrated into BusCMMS with automatic work order generation and scheduling.
Common Misconceptions About Brake Wear Prediction
Doesn't AI brake prediction eliminate the need for manual brake inspections?
No. Predictive maintenance supplements (not replaces) periodic manual brake inspections. Visual inspection can catch issues that sensor data might miss -- cracking, uneven wear, contamination. Best practice: use prediction to schedule when to perform manual inspection, then use inspection results to confirm or adjust the prediction model.
If prediction is 91% accurate, what about the 9%?
The 9% of predictions that don't result in service are typically: vehicles whose duty cycle changed (highway bus reassigned to urban routes), buses taken out of service for other maintenance before brake service date, or unexpected mechanical changes that affected brake performance. False-positives are rare; most misses are context changes outside the model's scope.
Do buses need special sensors installed for brake wear prediction?
No. AI brake wear prediction works with telematics data (GPS, accelerometer, temperature) that most modern buses already transmit. Pad wear sensors (electronic thickness sensors) are optional but enhance accuracy. Older buses without electronic sensors can use deceleration patterns and duty cycle alone, with slightly lower accuracy (83-87%).
Is brake prediction accurate on buses with highly variable duty cycles?
Yes, with some caveats. Vehicles with erratic routes (buses reassigned frequently, heavily loaded some days, lightly loaded others) show more variable wear. The AI model accounts for duty cycle variance and will show wider prediction windows (e.g., 4-8 weeks instead of 5-6 weeks) for high-variance vehicles. Accuracy remains 85-90% even with variable duty.
Frequently Asked Questions
How often should I calibrate the brake prediction model?
Can brake prediction work on older buses without electronic sensors?
What should I do if a predicted brake failure doesn't happen on schedule?
How does brake prediction integrate with CMMS work order scheduling?
Does brake prediction work for all brake types (air, hydraulic, hybrid)?
What is the minimum historical data needed to start brake prediction?
Can brake prediction account for driver-specific braking behavior?
How much does brake prediction cost, and what is the ROI?
Conclusion: From Calendar-Based to Prediction-Based Brake Maintenance
The transition from calendar-based brake service to AI-predicted brake maintenance is not a complete overhaul -- it is a gradual shift where historical calendar intervals are replaced with data-driven prediction windows that are unique to each vehicle's actual wear rate and duty cycle. A bus with 4-6 months of life remaining in its brake linings is not replaced; it is scheduled for service when prediction models indicate pad thickness will reach the minimum safe operating threshold in 4-6 weeks. A bus with accelerating brake wear is flagged for service sooner, before a failure can occur. The economic benefit is 20-35% reduction in brake maintenance cost and the elimination of emergency brake service calls. The safety benefit is even more valuable: predictable, scheduled brake maintenance with no unexpected failures means buses enter service with optimally maintained brake systems, every single day. Start your free BusCMMS trial and enable brake wear prediction on your fleet to see the accuracy and cost savings firsthand. Or schedule a demo with a BusCMMS fleet specialist to discuss brake prediction implementation for your specific fleet type and maintenance environment.







