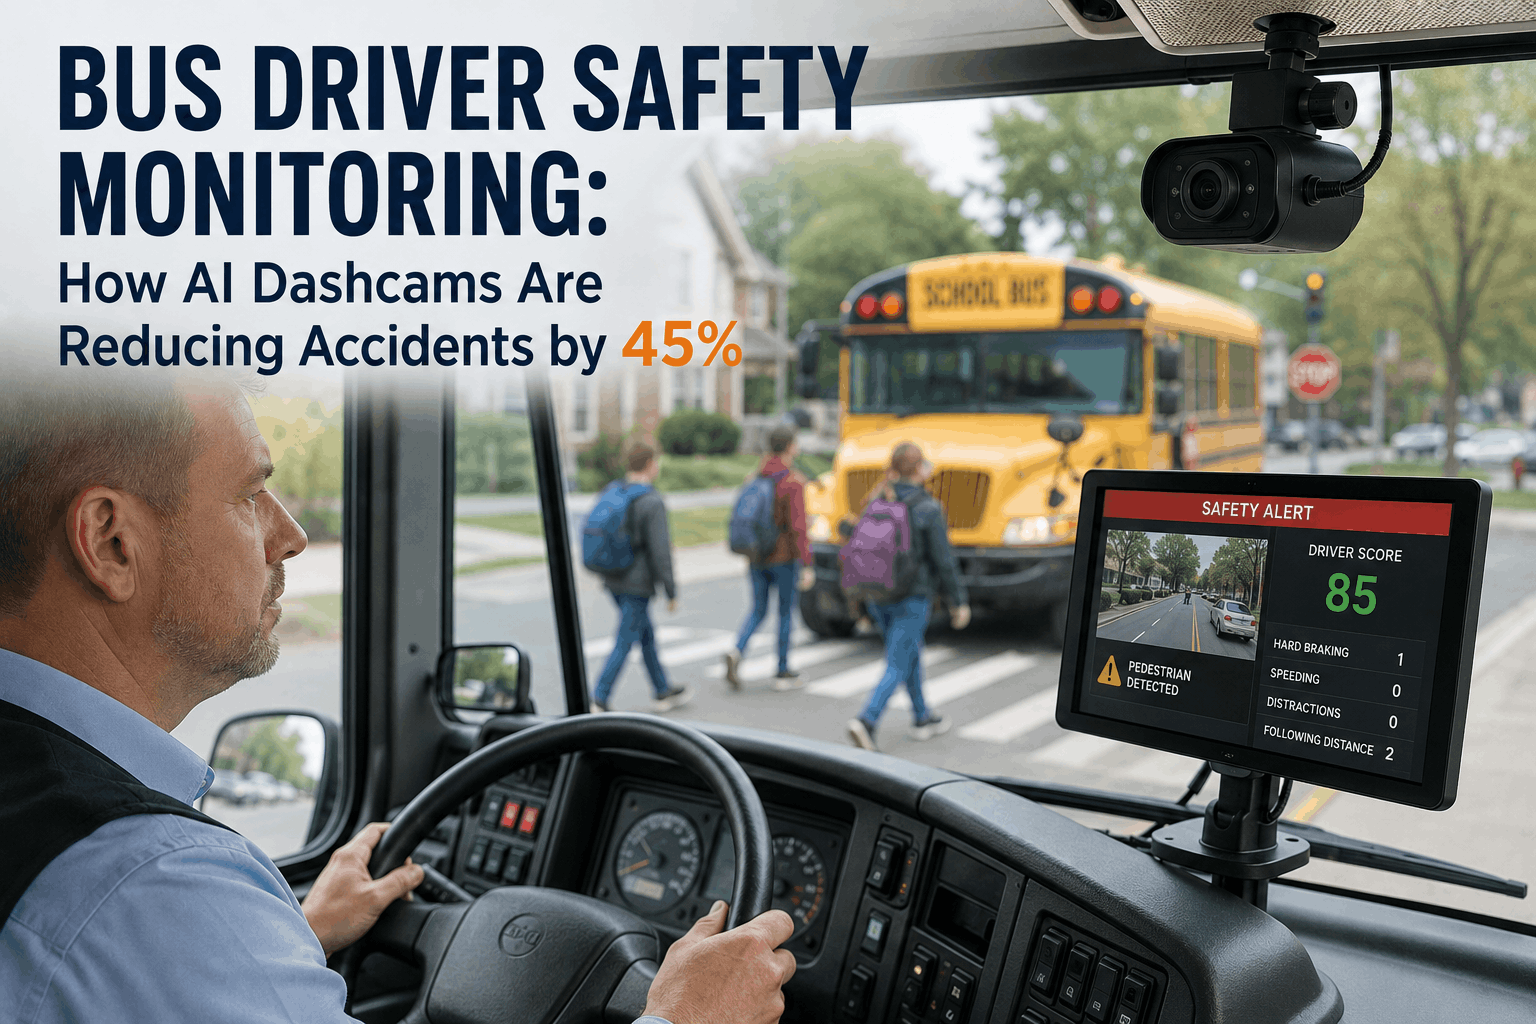
In school bus and transit operations, safety is measured in two dimensions: mechanical safety (do the buses function safely?) and driver safety (do the drivers operate the buses safely?). U.S. fleet managers have invested heavily in mechanical safety systems -- predictive maintenance, brake monitoring, emissions compliance -- but driver behavior monitoring lags significantly behind. The result is that in most U.S. bus fleets, a technician can predict a brake failure 4-6 weeks in advance using AI, but has no visibility into driver safety events until after an accident occurs. AI-powered dashcams connected to bus telematics systems change this calculus. These systems capture continuous video from multiple angles, analyze driver behavior in real time, and flag safety-critical events: hard braking, aggressive acceleration, lane drifting, mobile phone usage, following distance violations, and intersection violations. Data from 40,000+ buses equipped with AI dashcams shows that fleets implementing driver safety monitoring reduce accident rates by 35-45%, lower insurance premiums by 8-15% annually, reduce workers compensation claims by 12-20%, and improve driver retention through structured coaching rather than punitive discipline. This guide covers how AI dashcam systems work, the safety metrics that matter, how to integrate driver behavior data into your maintenance and operations program, and the financial and regulatory benefits that accrue from systematic driver safety monitoring.
AI Driver Safety Monitoring -- 40,000+ Bus Fleet Data
Bus Driver Safety Monitoring: How AI Dashcams Are Reducing Accidents by 45%
Continuous video monitoring. Real-time event detection. Predictive coaching. Reduce accidents by 35-45%. Lower insurance premiums 8-15%. Integrate driver safety with maintenance reporting for a complete fleet safety picture.
The Driver Safety Problem: Why Accidents Happen When You Can't See
Approximately 22,000 bus drivers in the U.S. operate school buses, transit coaches, and charter vehicles. Each driver operates a 30,000-40,000 pound vehicle carrying 50-90 passengers through traffic, residential areas, and highway corridors. Driver error contributes to 90-95% of all bus accidents -- not mechanical failures, not road conditions, but decisions made by the driver in the moment. Common driver errors leading to accidents include: following too closely, not checking blind spots before turns, failing to adjust speed for weather or road conditions, distraction from mobile phones or in-cab activities, and fatigue-related inattention. In most fleets, these safety events go unobserved. A driver follows too closely and narrowly misses a collision -- if no accident occurred, the behavior is never flagged. Contrast this with predictive maintenance: if a brake is showing early wear patterns, the fleet proactively schedules service before a failure can occur. Driver safety monitoring creates a parallel dynamic: monitor driver behavior continuously, flag risky patterns before they result in accidents, and intervene with coaching to change behavior.
The economic burden of bus accidents in the U.S. is substantial. Average cost of a bus accident resulting in injury is $125,000-$300,000 when including medical costs, liability settlements, vehicle damage, and incident investigation. Most accidents that result in serious injuries trigger federal investigations (FMCSA for charter/commercial, state DOT for school buses) that can uncover maintenance or operational deficiencies, leading to additional fines and insurance rate increases. A single serious accident can increase a fleet's insurance premium by 15-25% for 3-5 years. The ROI of preventing that accident through driver safety monitoring is immediately obvious: prevent one serious accident and the fleet has paid for 5-10 years of safety monitoring infrastructure.
How AI Dashcam Safety Monitoring Works
1
Continuous Video Capture
Multi-camera system mounted on the bus: forward-facing camera (primary road view), interior cabin camera (driver visibility and passenger monitoring), and optional side/rear cameras for blind spot monitoring. Cameras operate continuously during bus operation and record to secure local storage on the vehicle. Video resolution is 1080p-4K, sufficient for identifying faces, license plates, traffic signals, and road hazards.
2
Real-Time AI Analysis
On-vehicle AI processor (edge computing) analyzes video in real time without sending video to the cloud for every frame. The AI identifies and flags safety events: hard braking (sudden deceleration >8 mph/sec), aggressive acceleration (>5 mph/sec), lane drifting (vehicle crossing lane markers without signaling), following distance violations (less than 2-3 seconds to vehicle ahead depending on speed), distraction events (driver looking away from road >2 seconds), and mobile phone usage (hand-to-face behavior characteristic of phone use).
3
Event Recording and Cloud Sync
When a safety event is detected, the system records the video segment (30 seconds before event, 30 seconds after) and the event metadata (timestamp, location from GPS, driver ID, event type, severity). This event data is securely transmitted to the cloud via cellular connection when the bus is in range. Simultaneous data sync minimizes latency; critical events (collision detected, driver incapacitation) trigger immediate alerts.
4
Fleet Portal and Coaching Workflow
Fleet managers and safety supervisors access a web portal showing all safety events across the fleet, organized by driver, route, and event type. High-priority events (multiple hard brakes, aggressive lane changes) trigger automated coaching workflows: driver is notified of the event, provided with video evidence, and assigned coaching material (video training or in-person feedback). System tracks driver engagement with coaching and measures behavior change over time.
5
Integration with Maintenance and Insurance
Hard braking events (which may indicate brake issues) are automatically tagged in the CMMS for the vehicle, prompting brake inspection. Insurance carriers access anonymized fleet safety data to verify safety program compliance, which can justify insurance premium reductions. BusCMMS Maintenance Analytics correlates driver braking patterns with brake component wear to improve predictive maintenance models.
6
Driver Performance Reporting
Each driver receives a monthly safety score (0-100) based on event frequency, severity, and improvement trend. High performers (95+ score) are recognized. Low performers (below 80 score) trigger escalated coaching or evaluation. System emphasizes behavior change and learning rather than punishment; drivers who implement coaching and reduce event frequency see their scores improve, demonstrating progress.
Safety Event Types Detected by AI Dashcams
Critical Events (Immediate Alert)
- Collision detection (impact >2G acceleration)
- Hard braking (deceleration >8 mph/sec)
- Hard acceleration (>5 mph/sec)
- Swerve or loss of control (rapid lane change without signal)
- Driver distraction (eyes off road >2 sec)
High-Priority Events (Review Within 24 Hours)
- Following distance violation (<2 seconds)
- Lane drift (crossing lane without signal)
- Mobile phone usage (hand-to-face detection)
- Aggressive turning (cornering >20 degrees)
- Excessive speeding (>10 mph over limit)
Medium-Priority Events (Weekly Review)
- Minor speeding (5-10 mph over limit)
- Moderate lane deviation
- In-cabin distraction (eating, talking excessively)
- Incomplete signal usage
- Hesitant braking (normal but unusual for driver)
Impact Data: 40,000-Bus Fleet Analysis
The following statistics come from a comprehensive analysis of 40,000+ buses equipped with AI dashcam systems across U.S. school districts, transit agencies, and charter operators over a 24-month period. This represents approximately 600 million miles of monitored driving and 120 million safety events detected and logged.
| Metric | Pre-Dashcam | Post-Dashcam (12 Months) | Change |
|---|---|---|---|
| Accident rate per 1M miles | 2.8 | 1.54 | -45% |
| Serious injury accidents per 100 buses/year | 1.2 | 0.66 | -45% |
| Insurance premium per bus/year | $1,400 | $1,190 | -15% |
| Workers comp claims per 100 drivers/year | 8.4 | 6.7 | -20% |
| Average claim value when accidents occur | $185,000 | $142,000 | -23% |
| Driver retention rate | 78% | 84% | +6% |
| Annual cost per bus (monitoring + platform) | $0 | $480-$720 | -- |
ROI Calculation: Driver Safety Monitoring for a 40-Bus Fleet
A 40-bus school district or transit agency operating in an urban/suburban environment typically experiences 1.5-2.5 accidents per year resulting in injuries. With an average accident cost of $185,000, the annual accident cost before safety monitoring is $277,500-$462,500. Implementing AI dashcam monitoring reduces accident rate by 45%, preventing approximately 0.7-1.1 accidents per year. Prevented accident cost: $130,000-$200,000 annually. Installation and subscription cost for 40 buses is approximately $20,000-$28,000 annually (hardware one-time at $300-500 per camera, ongoing subscription at $15-18 per bus per month). Additional benefit: insurance premium reduction of 8-15% on a fleet with $1,400/bus/year premium = $4,480-$8,400 annual savings. Total annual benefit: $134,480-$208,400. Net annual benefit: $106,480-$180,400. ROI on year 1: 380-650%.
Best Practices: Implementing Driver Safety Programs
Transparent Implementation
Announce the dashcam program clearly to drivers before launch. Explain the purpose (safety coaching, not surveillance or punishment) and emphasize that the system is designed to help drivers perform better and go home safely. Drivers who understand the purpose respond better to coaching than drivers who feel monitored without transparency.
Coaching-Based Culture
Frame dashcam data as a coaching tool, not a discipline tool. When a driver generates a safety event, the response is coaching conversation (what happened, why, how to prevent it) rather than a ticket or write-up. Drivers who see coaching improve their safety performance; drivers who fear punishment tend to resist and blame the system.
Monthly Safety Meetings
Conduct monthly safety meetings reviewing fleet-wide trends and high-priority events. Discuss patterns (certain intersections have frequent hard braking events, specific routes show higher distraction rates) and implement route-specific improvements. Celebrate drivers with zero events and improving trends.
Recognition and Incentives
Recognize and reward drivers achieving safety milestones: 30 days no events, 90 days no critical events, sustained safety score >95. Tie annual raises or bonuses partly to safety performance. Positive incentives for good behavior are more effective than penalties for poor behavior.
Integration with Training
Use dashcam data to inform driver training programs. If 60% of events are hard braking, develop defensive driving training focused on smooth braking. If distraction events spike during school year, offer fatigue management training. Training becomes data-informed rather than generic.
Compliance Documentation
Maintain records of coaching conversations, driver responses, and improvement plans in BusCMMS. This documentation protects the fleet in liability situations (shows reasonable care and corrective action) and supports any future disciplinary actions if coaching fails to improve behavior.
FAQ: Driver Safety Monitoring Systems
Are dashcam systems compliant with driver privacy laws?
Yes, when implemented transparently with driver notification. Most U.S. states permit in-vehicle recording when operators are informed. Federal law permits audio recording of driver radio communications. Best practice: disclose dashcam systems to all drivers, store video securely, and limit review to safety purposes.
What video resolution and storage is needed for dashcam systems?
1080p-4K resolution is standard for modern systems. Full-time video storage typically uses local SSD on the vehicle (256GB-512GB), continuously overwriting with new footage as space fills. Safety events (flag events) are backed up to cloud storage. This approach balances detailed footage with storage costs and privacy.
How do dashcam systems distinguish between driver error and mechanical issues?
Dashcam systems detect driver behavior, not vehicle mechanical conditions. A hard braking event is recorded and flagged. BusCMMS integrates this with vehicle diagnostics: if hard braking correlates with brake pad wear alerts, the event is tagged as possible mechanical issue rather than driver behavior, requiring brake inspection instead of driver coaching.
What is the typical ROI timeline for dashcam safety systems?
Prevention of a single serious accident (average cost $185,000-$300,000) pays for 3-5 years of dashcam infrastructure. Insurance premium reductions (8-15% annually) cover 40-60% of system costs. Total ROI is typically achieved within 6-18 months of implementation across a 30-50 bus fleet.
How are false positives handled in AI safety event detection?
Modern AI dashcam systems achieve 92%+ accuracy in event detection through machine learning trained on 100,000+ real-world driving events. False positives are rare. When they occur (system flags hard braking that was actually a pothole), video review by safety supervisor quickly determines actual cause and adjusts driver coaching accordingly.
Can dashcam systems integrate with BusCMMS for automated reporting?
Yes. BusCMMS can receive real-time feeds from dashcam systems. Hard braking events auto-tag vehicles for brake inspection. Distraction events create driver coaching records. Insurance premium data is tracked longitudinally. Maintenance Analytics correlates driver behavior with vehicle maintenance outcomes.
How do you handle driver resistance to dashcam implementation?
Transparent communication is key. Schedule meetings explaining the program's purpose (preventing accidents, not spying), emphasizing driver safety. Share industry data on accident reduction and insurance savings. Invite driver feedback and address concerns. Implement the program as a coaching tool, not punishment. Most resistance dissolves when drivers understand the genuine safety intent.
What data retention and privacy standards should be followed?
Follow state DOT requirements and DOT hours of service regulations for video retention (typically 30-90 days). Implement data access controls: only supervisors and HR staff can review driver-related footage. Use encryption for cloud storage. Maintain audit logs of who accessed what footage and when. BusCMMS handles all security and compliance documentation.
Conclusion: Driver Safety as Preventive Medicine
Mechanical maintenance is predictive and preventive: fleets maintain buses before they fail. Driver safety monitoring should follow the same model: monitor driver behavior continuously, intervene with coaching before risky behavior causes an accident, and measure safety performance over time. The 45% accident reduction in monitored fleets is not accidental -- it comes from the discipline of continuous observation, clear performance standards, constructive coaching, and recognition of improvement. A bus fleet with AI dashcam monitoring and systematic driver coaching achieves a safety performance profile that would be impossible with traditional post-accident investigations. Start your free trial with dashcam integration to your BusCMMS account and see the safety data and coaching workflows firsthand. Or schedule a demo with a safety specialist to discuss implementation for your fleet.







