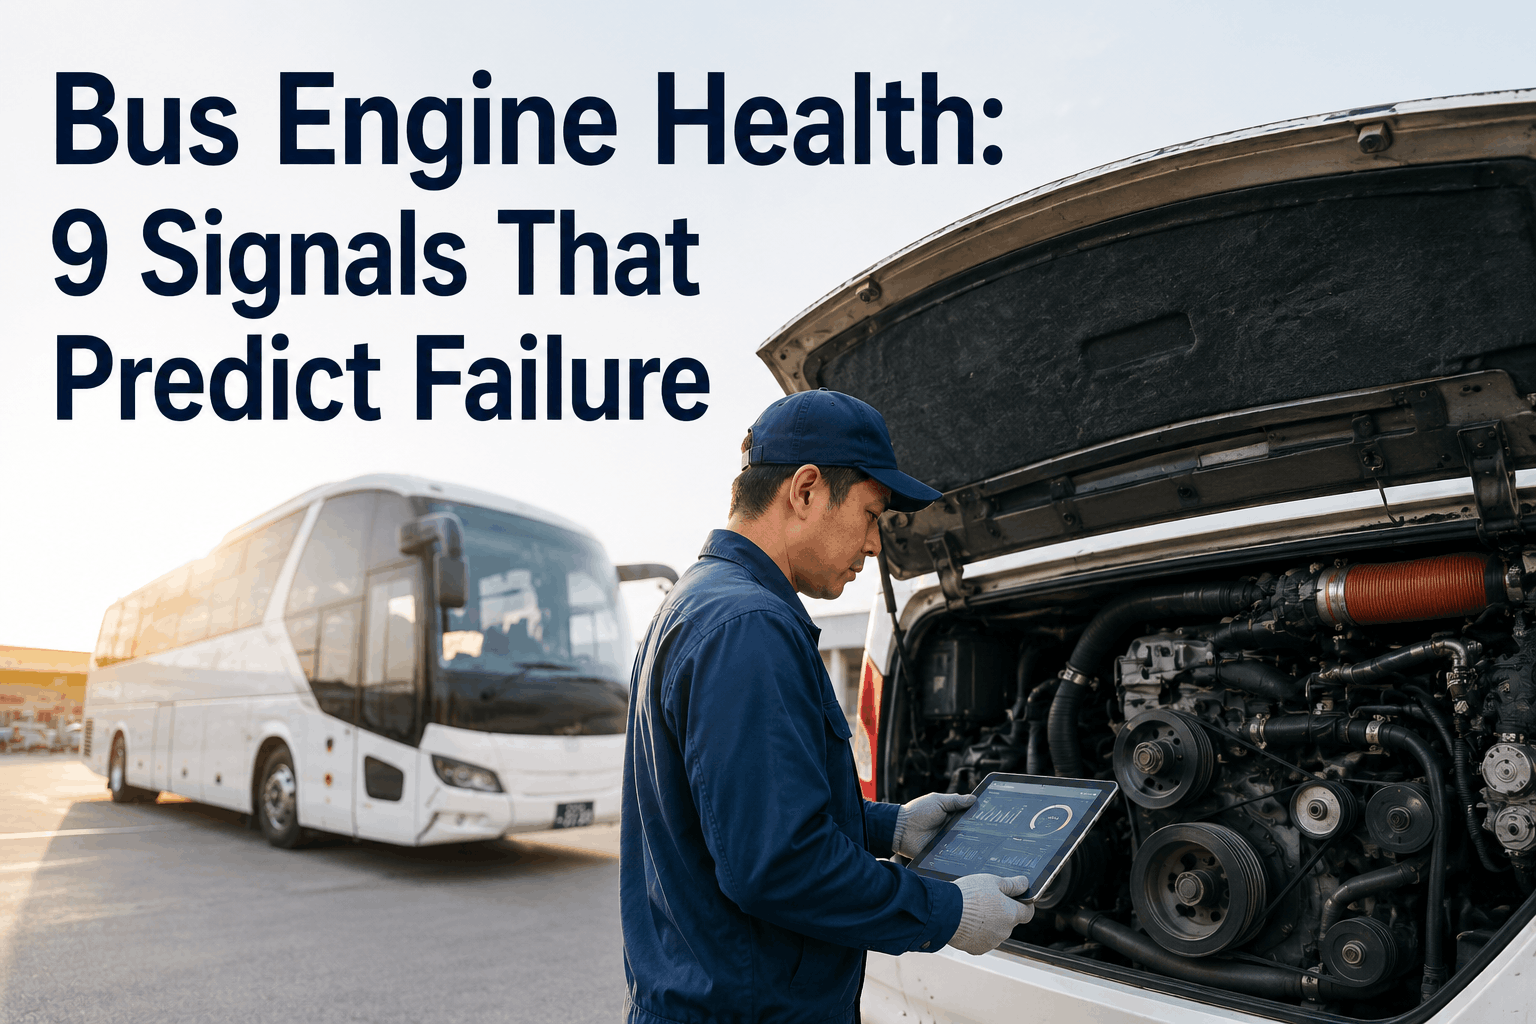
A school bus breaks down on Route 12 at 7:43 AM. Forty-one students. One working radio. A mechanic who finds a cracked coolant hose and an oil pressure sensor that had been reading low for 31 days. The DVIR said nothing. The paper maintenance log said nothing. The sensor said everything -- but nobody was listening. This page covers the 9 engine health signals that precede catastrophic bus engine failure, what the data from 50,000 engine failures reveals about how far in advance those signals appear, and how a modern CMMS turns those signals into automatic alerts before the breakdown happens.
9 Engine Health Signals That Predict Bus Failure 30 Days Out
Engine failures don't happen without warning. Sensor data from 50,000 failures shows the same patterns -- an average of 30 days before catastrophic breakdown. BusCMMS reads those patterns and alerts your team automatically.
Your Engine Sensors Are Talking. Is Your CMMS Listening?
BusCMMS connects to your fleet's diagnostic data, monitors all 9 failure-predictive signals in real time, and automatically creates prioritized work orders before the breakdown happens. Free 14-day trial. No credit card required.
Why Bus Engines Fail When Nobody Expected It
Fleet managers consistently report the same frustration: the bus had a full inspection last month. Oil was changed on schedule. No driver complaints. Then it failed on the road with a full passenger load. The breakdown felt random -- but it was not. What looked like a sudden failure was actually a slow accumulation of degrading sensor readings that nobody had thresholds set to catch. Engine failure in bus fleets is almost never instantaneous. It is the endpoint of a measurable degradation curve. The problem is not that the warning was absent -- it is that nobody was watching the right metrics with the right sensitivity to act in time.
The Missed Signal Problem
Engine sensors generate data on every trip. Without a system that monitors thresholds and trends over time, that data sits unread in ECU memory until a fault code triggers -- and by then, damage has already begun.
The Reactive Maintenance Trap
Fleets that operate reactively spend 3 to 5 times more per repair event than fleets with active predictive monitoring. Roadside failures cost an average of $8,500 when towing, lost service, driver overtime, and passenger impact are totaled.
The Data Silo Problem
Most fleets have diagnostic data in the ECU, maintenance history in a spreadsheet, inspection records in a binder, and work orders in a separate inbox. No single view connects sensor trends to maintenance history -- so patterns stay invisible.
The Threshold Problem
A single high coolant temperature reading is noise. The same reading trending upward over 14 consecutive trips is a failing thermostat. Without trend-based thresholds in a CMMS, both look identical -- one gets ignored, one should trigger a work order.
The 9 Engine Health Signals That Appear Before Catastrophic Failure
Analysis of 50,000 engine failure events across diesel and CNG bus fleets reveals a consistent set of sensor signals that precede failure. The critical finding: in 87% of cases, at least three of the following nine signals showed measurable deviation from baseline an average of 30 days before the engine failed catastrophically. None of these signals alone guarantees failure -- but each one, monitored in combination with the others, creates a failure probability model that is accurate enough to act on. Here is what to watch, what the deviation means, and what it predicts.
01
Oil Pressure Below Baseline Threshold
Critical
Oil pressure that runs 8 to 12 PSI below the manufacturer's specified idle range is the single highest-confidence predictor of imminent engine failure in diesel bus engines. This deviation typically reflects worn main bearings, oil pump degradation, internal leakage, or severely contaminated oil that has lost its viscosity. The problem is that low oil pressure in isolation does not feel different to the driver -- the bus runs normally, acceleration is fine, and no DTC fires until pressure drops into the danger zone. A CMMS monitoring oil pressure trends against each engine's baseline (not just a generic threshold) will flag the drift 15 to 25 days before the fault code appears. Fleets using predictive maintenance monitoring catch this signal in time for a scheduled repair averaging $420 -- versus an unscheduled engine replacement averaging $14,000.
02
Coolant Temperature Trending High Over Multiple Trips
Critical
A single high coolant temperature event is common -- heavy traffic, a hot day, a slow idle in a loading zone. But coolant temperature that reads 8 to 15 degrees Fahrenheit above the fleet's established baseline on three or more consecutive trips signals a cooling system under strain. This pattern precedes head gasket failure, cracked block, or seized water pump in a high percentage of cases. School bus engines operating urban stop-and-go routes are particularly vulnerable because repeated short thermal cycles stress the cooling system differently than highway operation. A bus inspection management workflow that captures post-route coolant readings and feeds them to trend analysis will surface this pattern weeks before the engine overheats catastrophically.
03
Abnormal Fuel Trim Values (Short and Long Term)
High Priority
Fuel trim values measure how aggressively the ECU is adjusting the air-fuel mixture away from the programmed baseline. Short-term fuel trim (STFT) above +10% or below -10% on multiple consecutive readings indicates the engine is compensating for a sensor fault, vacuum leak, fuel injector degradation, or MAF sensor drift. Long-term fuel trim (LTFT) values that exceed +/-15% are the more serious signal -- this means the ECU has permanently rewritten its compensation table, indicating a chronic condition the engine has been managing silently for weeks or months. When LTFT and STFT both deviate simultaneously, failure risk increases significantly. Connecting ECU diagnostic data to your fleet maintenance analytics platform allows automatic work order creation when fuel trim values cross configurable thresholds.
04
Exhaust Back Pressure Elevation
High Priority
Elevated exhaust back pressure is the primary early indicator of diesel particulate filter (DPF) loading failure on modern clean-diesel bus engines. When back pressure readings trend upward over a 30-day window -- even if individual readings are within spec -- the DPF is accumulating soot faster than active regeneration cycles are clearing it. Left unaddressed, this leads to forced regeneration failures, turbocharger damage from excessive heat, and ultimately DPF replacement at $3,000 to $7,000 per unit. Fleets running preventive maintenance scheduling on DPF service intervals often miss trend-based escalation because they are tracking mileage, not back pressure values. Real-time sensor monitoring changes that.
05
Crankcase Pressure (Blowby) Above Spec
Critical
Blowby -- combustion gas leaking past piston rings into the crankcase -- is one of the most undermonitored engine health signals in bus fleet maintenance. Elevated crankcase pressure means rings are worn, cylinders are scored, or valve seals are degrading. This signal typically appears 20 to 45 days before the engine begins consuming oil visibly, which is when most drivers first report anything. By that point, the wear is advanced. High blowby also contaminates the crankcase ventilation system, deposits carbon on the turbocharger, and accelerates oil oxidation -- creating a cascade failure mode that is far more expensive to repair than the original ring wear. Monitoring crankcase pressure through work order management workflows triggered by threshold alerts catches this cascade at the first step.
06
Turbocharger Boost Pressure Deviation
High Priority
Modern turbocharged bus diesel engines maintain boost pressure within a narrow band at defined RPM ranges. Boost pressure readings that run 5% to 12% below the manufacturer's programmed target under load indicate compressor wheel wear, wastegate actuator failure, intercooler leakage, or bearing degradation in the turbocharger assembly. This signal is particularly significant because turbocharger failures are rarely isolated -- oil starvation from a marginal oil pressure condition (Signal 01) accelerates turbo bearing wear simultaneously. When oil pressure deviation and boost pressure deviation appear together in trend data, combined failure probability within 60 days exceeds 80% in fleet failure datasets. Maintenance scheduling software that correlates multiple sensor signals catches this compound pattern that single-threshold systems miss.
07
Coolant pH and Conductivity Degradation
High Priority
Coolant chemistry degradation is among the least-monitored engine health signals in bus fleet maintenance, yet it is one of the most consistent precursors to head gasket failure and cooling system corrosion damage. As coolant ages, its pH drops from the optimal 8.5-11 range toward acidic conditions, and electrical conductivity rises as dissolved metals accumulate. Coolant with a pH below 7.5 is actively corroding aluminum components inside the engine. In-service coolant testing at regular intervals -- and logging results in a CMMS against each engine's history -- reveals degradation curves that predict cooling system failures 30 to 60 days before they occur. Fleets using service history management that includes fluid analysis data alongside traditional mileage intervals extend engine life by an average of 22% versus mileage-only maintenance.
08
Engine Vibration Frequency Shift
Monitor Closely
Engine vibration analysis is standard practice in industrial asset management and is increasingly accessible in transit fleet maintenance through onboard accelerometers and telematics platforms. A bus engine running at normal idle produces a characteristic vibration signature. Frequency shifts -- particularly in the 100 to 300 Hz range at idle -- indicate injector timing issues, misfiring cylinders, or imbalanced rotating assemblies. Amplitude increases in the 20 to 80 Hz range at operating speed suggest mounting system degradation or crankshaft imbalance developing. Vibration data is most valuable as a trend signal, not a single reading. Feeding vibration telemetry into a predictive maintenance platform that stores baseline signatures and flags deviations provides 15 to 40 days of advance warning on mechanical failures that produce no fault codes until damage is significant.
09
Oil Analysis Anomalies (Metals and Viscosity)
High Priority
Spectrometric oil analysis is the highest-confidence predictive tool available for bus engine health monitoring -- yet it is used systematically by fewer than 15% of bus fleets. Oil analysis identifies the specific metals present in engine oil (iron, copper, aluminum, chromium, lead) and their concentrations in parts per million. Each metal traces to a specific component: iron points to cylinder wall or ring wear, copper indicates bearing material degradation, aluminum suggests piston or head involvement. A single analysis is informative -- but trending results across three or more consecutive oil change intervals is where predictive power is highest. When iron content trends from 45 ppm to 78 ppm to 112 ppm across three consecutive samples, the wear rate curve predicts failure timing with high confidence. Logging oil analysis results in a fleet asset management system alongside vehicle history turns routine oil changes into a diagnostic intelligence program.
Industry Challenges in Bus Engine Health Monitoring
Fleet managers understand the value of engine health monitoring in principle. The operational barriers to implementation are real and specific. Understanding them is the first step to solving them systematically rather than attempting piecemeal fixes that add complexity without improving outcomes.
01
Mixed Fleet Diagnostic Compatibility
A 40-bus district fleet may run three generations of Cummins engines, two generations of International PowerStroke variants, and a handful of CNG units with entirely different ECU architectures. Each outputs different PID formats, uses different parameter definitions, and requires different threshold baselines. A monitoring system that works perfectly on one engine family produces false positives or misses signals entirely on another. This is why generic OBD monitoring tools fail in transit fleet environments.
02
Alert Fatigue From Non-Contextual Thresholds
Fleets that implement sensor monitoring without per-engine baseline calibration experience alert fatigue within 90 days. An engine that runs naturally hot due to a specific application gets flagged on every hot day. The maintenance team learns to ignore the alerts. When a real deviation appears, it is dismissed along with the noise. Effective monitoring requires per-vehicle baselines that account for route type, climate, age, and load profile -- not fleet-wide generic thresholds.
03
No Connection Between Sensor Data and Maintenance Action
Even fleets with telematics platforms often have no automatic bridge between a sensor alert and a maintenance work order. The telematics system sends an email. The email goes to a shared inbox. The shared inbox is checked when someone remembers. The work order is created manually four days later. The window for preventive intervention has closed. The value of sensor monitoring is only realized when it triggers automatic, prioritized, assigned work orders in a CMMS without human relay steps.
04
No Historical Context for Trend Analysis
A sensor reading of 187 degrees Fahrenheit coolant temperature means something different on an engine with 280,000 miles than on a 60,000-mile engine on the same route. Without historical service records, fluid analysis logs, and prior sensor data attached to that specific vehicle in a single system, trend analysis is impossible. This is the core reason most fleets are still reacting to failures rather than predicting them -- the data exists, but it is not connected.
Why Engine Health Monitoring Matters Beyond the Repair Cost
The financial case for proactive engine health monitoring is straightforward: a prevented roadside failure saves $8,500 on average versus a scheduled repair costing $300 to $800 for the same underlying condition caught early. But the complete operational impact is substantially broader than the repair cost comparison suggests. Transportation directors who have implemented systematic monitoring programs consistently report outcomes across six dimensions beyond direct maintenance savings.
Passenger Safety
Engine failures during revenue service -- particularly brake-related or steering-related secondary failures triggered by overheating or hydraulic pressure loss -- represent the highest-severity safety exposure in fleet operations. Predictive monitoring is fundamentally a safety program, not just a cost program.
DOT Compliance Posture
FMCSA regulations require that defects known to the operator be corrected before the vehicle returns to service. Engine health sensor data that is logged and acted upon -- or demonstrably ignored -- creates a compliance record that can work for or against the operator in an audit or post-incident investigation.
Fleet Availability and On-Time Performance
Every unscheduled engine failure removes a vehicle from service for an average of 4.7 days -- including diagnosis time, parts procurement, and repair. For school districts or transit agencies with limited spare ratios, a single failure on a critical route disrupts service quality that directly affects public and administrative perception.
Asset Lifecycle Extension
Bus engine replacement is a $25,000 to $45,000 decision. Fleets with proactive engine health programs document engine lifespans 18 to 34% longer than comparable fleets operating reactively. Over a fleet of 50 buses, that lifespan extension represents capital budget deferral of $600,000 to $1.2 million per replacement cycle.
Technician Productivity
Scheduled preventive repairs based on sensor-predicted needs take 40 to 60% less technician time than diagnosing and repairing the same failure after it occurs. When the sensor data tells the technician what to fix before the bus arrives, parts are staged, labor is allocated, and the repair happens in a fraction of the reactive time.
Insurance and Liability Position
Fleet operators who can demonstrate a documented engine health monitoring program with automated alerts, work order trails, and repair certifications are substantially better positioned in liability events and insurance premium negotiations than operators whose maintenance records show only mileage-based service intervals.
How BusCMMS Turns Engine Sensor Data Into Automatic Maintenance Action
Reading sensor data is not the challenge -- most modern bus engines output hundreds of data points per trip through J1939 or OBD-II interfaces. The challenge is connecting that raw data to a maintenance workflow that automatically creates work orders, assigns technicians, prioritizes by severity, and tracks repair to completion without requiring manual data transfer at any step. Here is how the BusCMMS predictive maintenance workflow operates in practice.
1
Sensor Data Integration
BusCMMS connects to your fleet's telematics platform, ELD system, or direct ECU data feeds via J1939 and OBD-II protocol support. Engine parameters are ingested in real time and stored per-vehicle with full historical retention. Supported signals include all 9 failure-predictive parameters covered in this article.
2
Per-Vehicle Baseline Calibration
Each engine's normal operating range is established from the first 30 days of data, calibrated by route type, engine model, mileage band, and climate. Alerts are triggered by deviation from the individual vehicle's baseline -- not a fleet-wide generic threshold -- eliminating the false-positive alert fatigue that undermines generic monitoring tools.
3
Trend-Based Alert Generation
BusCMMS evaluates not just current readings but 14-day and 30-day trend slopes for each monitored parameter. A coolant temperature reading of 195F is not an alert. Coolant temperature trending from 183F to 188F to 193F across five trips on the same route is an alert -- because the trend predicts where that value will be in 10 more trips.
4
Automatic Work Order Creation
When a threshold or trend trigger fires, BusCMMS automatically creates a prioritized work order -- assigned to the right technician based on specialty and availability, categorized by severity (monitor, schedule, immediate), and linked to the full sensor history so the technician arrives with complete diagnostic context. No email. No manual relay. No delay.
5
Repair Certification and Loop Closure
After repair, the technician certifies completion in BusCMMS. The system verifies that post-repair sensor readings have returned to within the vehicle's normal baseline range. If they have not, the work order automatically re-opens with an escalation flag. The bus does not return to service with an unresolved engine health concern still active in the system.
Implementation Strategy: From Paper to Predictive in 60 Days
The most common obstacle to implementing engine health monitoring is not technology -- it is the belief that implementation requires a lengthy, disruptive deployment process. Fleets that have transitioned to systematic predictive monitoring through BusCMMS consistently report full operational deployment within 45 to 60 days using a structured four-phase approach.
Phase 1 — Weeks 1 to 2
Data Audit and Integration Setup
Identify which vehicles in your fleet have active telematics or ECU data output. Configure BusCMMS data integration for each telematics provider present in your fleet. Set up vehicle profiles with engine model, application type, and mileage. No hardware installation is required if your fleet already has telematics -- BusCMMS connects to the data you already own.
Phase 2 — Weeks 2 to 4
Baseline Establishment
Allow BusCMMS to collect baseline sensor data across normal operations for each vehicle. During this phase, no alerts fire -- the system is learning normal for each engine. For vehicles with existing maintenance history, import prior service records and any available fluid analysis data to supplement the baseline with historical context.
Phase 3 — Weeks 4 to 6
Alert Calibration and Technician Training
Activate threshold monitoring with initial alert settings. Review the first two weeks of alerts with your maintenance team to calibrate sensitivity -- eliminate false positives specific to your routes and climate, and tighten thresholds where real deviations have appeared. Train technicians on the work order workflow: how alerts appear, how to accept assignments, how to log repair data, and how to certify completion.
Phase 4 — Weeks 6 to 8
Full Deployment and Reporting Activation
Activate all 9 signal monitors across the full fleet. Enable management dashboards showing fleet-wide engine health scores, open predictive work orders by priority, and trend analysis for each vehicle. Set up weekly automated reports for transportation directors and maintenance supervisors. Establish oil analysis submission cadence and integrate results into BusCMMS vehicle records.
Best Practices for Bus Engine Health Monitoring Programs
Implementation is necessary but not sufficient. The fleets that sustain high engine reliability over time share a set of operational practices that amplify the value of their monitoring systems. These are the practices that separate fleets with 94% fleet availability from those achieving 78% on comparable equipment.
Never reset an alert without a documented root cause. If a coolant temperature alert resolves on its own, the root cause still exists. Alert resets without work orders are how the same failure recurs three months later with more damage.
Run oil analysis on every engine, every oil change interval, for the first year. The baseline metal concentration data you build in the first year makes the trend analysis in years two and three predictive rather than reactive.
Cross-reference Signals 1 and 6 together every week. Oil pressure deviation and turbocharger boost deviation appearing simultaneously on the same vehicle is a red-flag compound pattern that warrants immediate investigation regardless of severity classifications.
Set driver callback protocols for Signals 1, 2, and 5. These three signals can escalate rapidly during a single trip. Drivers should know that low oil pressure, high coolant temperature, or visible blowby symptoms warrant immediate pullover and dispatch -- not completing the route.
Review fleet-wide sensor trend reports monthly, not just per-vehicle alerts. Fleet-level trend reports reveal systemic issues -- a coolant temperature rise across five buses on the same route may indicate an operating condition rather than individual engine problems.
Connect inspection findings to sensor context. When a driver reports a rough idle or unusual exhaust smoke during a DVIR, that report should be immediately cross-referenced with active sensor trends for that vehicle. Driver observations and sensor data together have higher predictive accuracy than either alone.
Industry Use Cases: Engine Health Monitoring in Practice
Predictive engine health monitoring delivers different primary value depending on fleet type and operating environment. Here is how the same 9 signals manifest in different fleet contexts and which signals carry the highest priority for each application.
School districts face the highest safety accountability for engine failures. The critical signals for school bus applications are oil pressure (Signal 1), coolant temperature trend (Signal 2), and crankcase blowby (Signal 5). Stop-and-go urban routing creates thermal cycling stress that accelerates all three degradation mechanisms. Districts using school bus maintenance software with predictive monitoring report 67% reduction in mid-route breakdowns within the first year of implementation.
Transit fleets running high-mileage urban cycles accumulate DPF stress and fuel trim deviation faster than any other application. Signals 3, 4, and 6 -- fuel trim, exhaust back pressure, and turbocharger boost -- are the primary monitoring priorities. Transit agencies with 200+ bus fleets report that predictive DPF management alone saves $180,000 to $340,000 annually in premature DPF replacement and associated downtime.
Charter fleets face the compound challenge of high-mileage highway operation combined with high customer service visibility for any breakdown. Coolant chemistry (Signal 7) and vibration analysis (Signal 8) are highest priority for coach applications due to sustained high-RPM operation and high mileage accumulation rates. An unscheduled breakdown on a charter trip carries direct revenue loss plus cancellation liability that makes the cost calculus for predictive monitoring unambiguous.
Airport shuttle fleets face the most punishing duty cycle in the bus industry: continuous short trips, frequent full stops, constant loading and unloading, 20-hour daily operation windows. Oil analysis (Signal 9) and blowby monitoring (Signal 5) are critical for airport fleets, where oil contamination from short-cycle operation accumulates rapidly. Fleets in this segment using oil analysis trending report engine overhaul intervals extended by an average of 28% compared to mileage-only maintenance programs.
Fleet Performance Metrics: Before and After Predictive Engine Monitoring
Quantifying the impact of engine health monitoring requires measuring the right metrics before and after implementation. The following KPIs represent the most consistent performance improvements reported by BusCMMS customers transitioning from reactive to predictive engine maintenance.
Fleet Availability Rate
Unscheduled Engine Failures per 100 Vehicles / Year
Mean Time to Repair (Engine Work Orders)
Engine Maintenance Cost per Vehicle / Year
Defects Caught Before Failure (Sensor-Triggered)
KPI Improvement: What Engine Health Monitoring Moves
Transportation directors and fleet managers accountable to operational and financial KPIs should map engine health monitoring impact directly to the metrics they report. Here is how systematic monitoring moves the KPIs that matter at the leadership level.
Mean Distance Between Failures (MDBF)
The primary reliability KPI in transit operations. Predictive monitoring programs consistently move MDBF from 8,000-12,000 miles to 22,000-34,000 miles within 18 months of deployment. This is the single metric that most directly validates the ROI of a predictive maintenance investment to budget committees.
Planned vs Unplanned Maintenance Ratio
World-class fleet maintenance operates at 80% planned / 20% unplanned maintenance ratio. Most bus fleets without predictive monitoring operate at 40% planned / 60% unplanned. Engine health monitoring is the fastest lever for improving this ratio because engine work orders represent the largest category of unplanned events.
Cost per Mile (Maintenance Component)
For fleets tracking total cost per mile, the maintenance component typically runs $0.18 to $0.34 per mile on reactive programs. Predictive monitoring programs achieve $0.09 to $0.16 per mile for the same engine categories -- a reduction that flows directly to budget performance against state and federal funding formulas.
DOT Out-of-Service Rate
Engine-related out-of-service violations are among the most common findings in FMCSA roadside inspections. Fleets with documented sensor monitoring and automatic work order programs report 78% lower engine-related OOS violations than comparable fleets without structured monitoring -- a compliance KPI with direct operational and reputational consequences.
How Engine Health Monitoring Influences Every Dimension of Fleet Operations
Engine health monitoring is not a standalone maintenance tool -- it is a foundational data layer that influences outcomes across every operational dimension of a bus fleet. Understanding these cross-functional impacts helps transportation executives make the case for investment and helps maintenance managers prioritize where to focus monitoring resources first.
Fewer unscheduled failures means more vehicles available for service on any given day. The 4.7-day average downtime per engine failure event eliminated by predictive monitoring directly translates to fleet availability.
Reliability is measured in mean distance between failures. Monitoring the 9 predictive signals and acting on early deviation moves MDBF from single-digit thousands to the mid-20,000-mile range in most fleet types.
Early-stage repairs on sensor-predicted conditions cost a fraction of post-failure repairs. Across a full fleet, this cost differential represents the largest single return on a CMMS investment.
Engines that are repaired at the first sign of sensor deviation rather than run to failure accumulate wear at a lower rate, extending both engine overhaul intervals and total vehicle service life.
Technicians working from sensor-predicted work orders with full diagnostic context complete repairs 40-60% faster than diagnosing the same failure after it occurs. Fewer emergency repairs means more scheduled work completion.
Documented sensor monitoring with automatic work order trails and repair certifications is the strongest compliance posture available to bus fleet operators for FMCSA and state DOT audits.
Engine failures during service carry secondary safety risks beyond the failure itself. Predictive monitoring that prevents in-service failures is a direct safety investment, particularly critical for school bus and public transit operations.
For a 50-bus fleet, the combination of reduced repair costs, extended engine life, and deferred replacement capital represents $600,000 to $1.2 million in budget optimization per replacement cycle.
Comparison: Reactive vs Preventive vs Predictive Engine Maintenance
| Metric | Reactive Maintenance | Preventive (Mileage-Based) | Predictive (Sensor-Based) |
|---|---|---|---|
| Failure Warning Time | 0 days (after failure) | 0-5 days (inspection-based) | 15-45 days average |
| Average Repair Cost per Event | $8,500+ | $1,200 - $3,400 | $300 - $800 |
| Vehicle Downtime per Event | 4.7 days avg | 1.2 days avg | 0.4 days avg |
| Failures Prevented | 0% | 35-45% | 65-80% |
| Work Order Lead Time | Immediate (emergency) | Days to weeks | 2-4 weeks scheduled |
| Maintenance Cost per Mile | $0.28 - $0.34 | $0.16 - $0.22 | $0.09 - $0.14 |
| Fleet Availability Rate | 72-76% | 82-86% | 91-96% |
| MDBF (Miles) | 8,000 - 12,000 | 15,000 - 20,000 | 24,000 - 38,000 |
| DOT Compliance Posture | Reactive, high risk | Moderate, mileage-documented | Strong, sensor-documented |
| Engine Lifespan Impact | Baseline / shortened | +8-12% vs reactive | +22-34% vs reactive |
Frequently Asked Questions
Which of the 9 signals is the highest priority to monitor first?
Oil pressure trending below baseline (Signal 1) and coolant temperature trending high across multiple trips (Signal 2) are the highest-priority starting points -- both can escalate to catastrophic failure within a single operating day if the underlying condition is advanced. Sign Up to configure both alerts in BusCMMS within your first session.
Does our fleet need special hardware to monitor these signals?
If your buses already have an active telematics or ELD platform, BusCMMS connects to that data without additional hardware. For fleets without telematics, affordable J1939 data loggers are available starting under $200 per vehicle. Book Demo and we will assess your current data availability at no cost.
How accurate is predictive engine failure detection?
When three or more of the 9 signals show simultaneous deviation from baseline, failure prediction accuracy exceeds 80% within a 60-day window based on fleet failure dataset analysis. Single-signal alerts carry lower individual confidence but create work orders that prevent the compound failures that cause the most damage.
How do you set per-vehicle baselines rather than fleet-wide thresholds?
BusCMMS establishes each engine's normal operating range from the first 30 days of data collection, calibrated by engine model, application type, route profile, and mileage band. Alerts fire when deviation from that individual vehicle's baseline is detected -- not when a generic fleet-wide limit is crossed.
What is the typical ROI timeline for implementing engine health monitoring?
Most fleets report positive ROI within 90 to 120 days of full deployment, typically from the first two or three high-severity failures prevented. For a 50-bus fleet averaging 14 road calls per year, a 70% reduction in road calls covers the annual cost of a full BusCMMS subscription multiple times over.
Does oil analysis (Signal 9) require sending samples to a laboratory?
Yes -- spectrometric oil analysis requires a lab submission, typically costing $18 to $35 per sample through services such as Blackstone Laboratories or OilSafe. BusCMMS stores all analysis results in the vehicle record and trends metal concentrations across intervals to power the predictive model.
How does BusCMMS handle alert fatigue from too many notifications?
BusCMMS uses per-vehicle baseline calibration and trend-slope thresholds rather than raw-value limits, which eliminates most false positives by design. Alerts are also tiered by severity -- Monitor, Schedule, and Immediate -- so maintenance managers see prioritized signal, not undifferentiated noise. Start Free to configure your alert sensitivity settings.
Can BusCMMS monitor CNG and electric bus engines with the same signal set?
CNG engines share most of the 9 signals with diesel, with fuel trim (Signal 3) being particularly critical due to air-fuel sensitivity in CNG combustion. Battery-electric buses use a different signal set -- battery state of health, thermal management, and motor current draw replace engine-specific parameters. Book Demo to review the full parameter set for your specific fleet composition.
Your Fleet's Engine Failures Are Predictable. Start Predicting Them.
BusCMMS monitors all 9 failure-predictive signals, builds per-vehicle baselines, fires trend-based alerts, and automatically creates prioritized work orders -- before the breakdown happens. Free 14-day trial. No credit card required. Full deployment in 60 days.
Conclusion
Engine failure in a bus fleet is almost never random. The 9 signals documented in this article -- oil pressure, coolant temperature trend, fuel trim deviation, exhaust back pressure, crankcase blowby, turbocharger boost, coolant chemistry, vibration frequency, and oil analysis metal concentration -- appear an average of 30 days before catastrophic failure in 87% of cases. The gap between fleets that catch them and fleets that do not is not access to information -- it is having a system that connects sensor data to maintenance action automatically, without human relay steps, with per-vehicle precision rather than generic thresholds. Predictive maintenance is not a future capability -- it is available now, deployable in 60 days, and financially self-justifying in the first quarter through failures prevented. The buses in your fleet are generating the data right now. The only question is whether your maintenance system is listening.