Right now, somewhere in America, a school bus is sitting on a shop lift because something broke on a route this morning. The mechanic is waiting on an emergency parts order. The transportation director is scrambling to cover 3 routes with 2 spare buses. And the maintenance budget just absorbed another unplanned hit that costs 3–5x more than it would have if anyone saw it coming. This is Level 1 maintenance — and 73% of bus fleets are still stuck here. The good news? Getting to Level 3 doesn't require a Silicon Valley budget. It requires a plan.
AI Maintenance Roadmap 2026
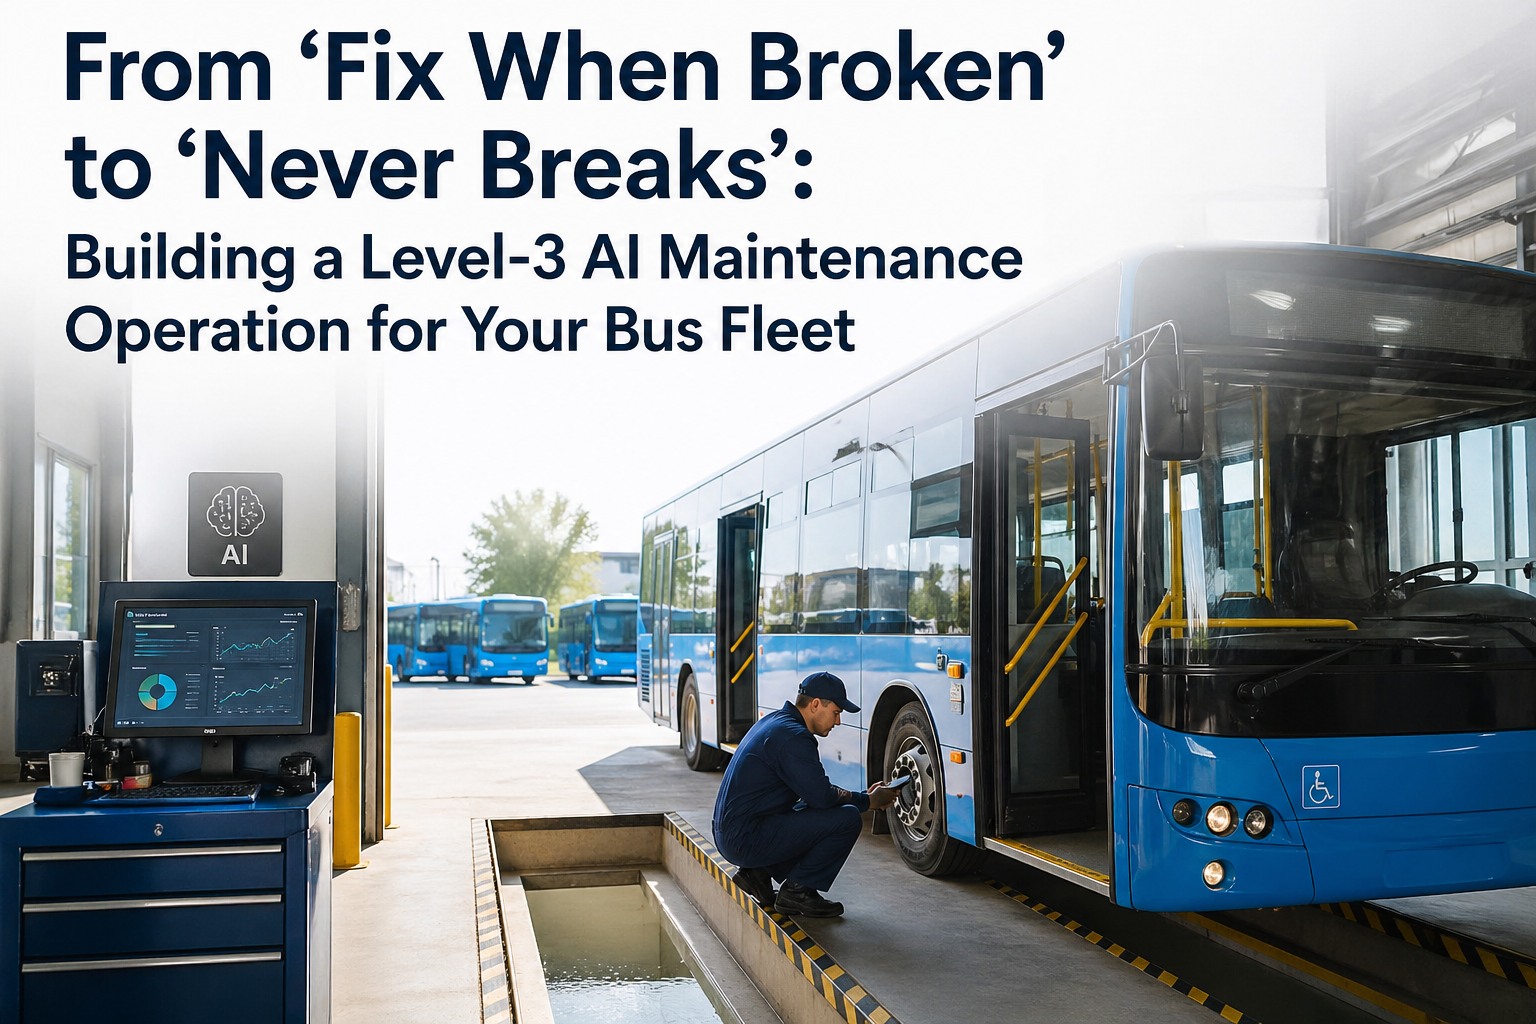
From 'Fix When Broken' to 'Never Breaks': Building a Level-3 AI Maintenance Operation for Your Bus Fleet
Most bus fleets are stuck at Level 1 reactive maintenance. This guide shows how to climb to Level 3 — AI-driven condition monitoring — without a massive IT budget.
73% of Fleets Still Reactive
62% Fewer Breakdowns at L3
30% Lower Maintenance Costs
01
The 3 Maintenance Maturity Levels — Where Does Your Fleet Sit?
Every bus fleet falls into one of three maintenance maturity levels. Be honest with yourself here — the gap between where you think you are and where you actually are is usually the most expensive problem in the shop.
L1
Reactive — "Fix When Broken"
73% of bus fleets
You're here if:
Work orders start with a phone call from a stranded driver
PM schedules exist on paper but get pushed when buses are needed on routes
Parts inventory is managed by "what we ran out of last time"
Maintenance costs are unpredictable month-to-month
Cost per mile
$0.25–$0.45
L2
Preventive — "Fix on a Schedule"
22% of bus fleets
You're here if:
PM schedules run on mileage or calendar triggers and are mostly followed
DVIR inspections are digital and defects create tracked work orders
You have a CMMS but it mostly logs history — it doesn't predict anything
Breakdowns are less frequent but still surprise you monthly
Cost per mile
$0.12–$0.22
L3
Predictive/AI — "Fix Before It Fails"
~5% of bus fleets
You're here if:
Telematics data feeds your CMMS and triggers condition-based work orders
Your system flags a failing alternator 2–4 weeks before it strands a bus
Parts are ordered before the mechanic knows they're needed
Breakdowns are a quarterly surprise, not a weekly one
Cost per mile
$0.03–$0.08
Here's the key insight: you can't skip levels. A fleet that jumps from paper logs straight to AI will drown in data they can't act on. Each level builds the data foundation and process discipline the next level needs. But you can accelerate through them — most fleets move from Level 1 to Level 2 in 30–60 days, and from Level 2 to Level 3 in 90–180 days with the right platform.
Find out which level your fleet is at — free 20-minute assessment
02
The Money You're Leaving on the Shop Floor
Abstract maturity models don't get budget approval. Dollar figures do. Here's what each level costs a 50-bus school district annually — and what you save by advancing.
Level 1 — Reactive
Emergency repairs
$185,000
Parts (rush shipping)
$92,000
Downtime cost
$134,000
Overtime labor
$67,000
Annual Total
~$478,000
Save ~$240K/yr
Level 3 — Predictive AI
Planned repairs
$98,000
Parts (planned orders)
$55,000
Downtime cost
$42,000
Software + platform
$43,000
Annual Total
~$238,000
That's a 50% reduction in total maintenance spend — and it doesn't count the soft benefits: fewer parent complaints, better driver morale, lower insurance exposure, and the DOT audit that's a non-event instead of a crisis. The CMMS platform itself is the smallest line item on the entire budget.
03
The 90-Day Roadmap: Level 1 → Level 3
This is the exact progression that districts follow to get from paper-and-prayer maintenance to AI-driven operations. No massive IT budget. No data science team. Just a modern CMMS that does the heavy lifting.
Days 1–14
Foundation: Digitize Everything
Load your fleet into CMMS — every bus, every VIN, every mileage reading
Activate digital DVIRs with pre-loaded school bus inspection templates
Set up PM schedules on mileage and calendar triggers — auto-generated work orders
Migrate maintenance history from spreadsheets or paper logs via CSV import
You're now at Level 2. PM compliance jumps to 85%+ in the first month.
Days 15–45
Connect: Plug In Your Data Sources
Connect GPS/telematics (Samsara, Geotab, Zonar) — odometer readings auto-sync
Enable fault code ingestion — engine codes auto-create prioritized work orders
Link fuel card data — per-bus consumption tracking and anomaly alerts
Establish baselines: what does "normal" look like for each bus?
Your CMMS now has the data AI needs. By month 2, models hit 90%+ accuracy.
Days 46–90
Intelligence: Activate AI-Driven Maintenance
AI analyzes fault patterns + component history + usage data to predict failures 2–4 weeks out
Automated alerts notify your shop when a specific bus has a high-probability failure risk
Work orders auto-generate with recommended parts, labor estimates, and priority scores
Measure results: track unplanned breakdowns, cost per mile, and PM compliance weekly
You're at Level 3. Breakdowns are predicted, not reacted to. First prevented failure typically covers your entire annual software cost.
Sign up free and start Day 1 of your roadmap in the next 10 minutes
04
What Level 3 Actually Looks Like at 6:15 AM on a Monday
Theory is great. Let's talk about what changes in your actual day-to-day when AI maintenance is running.
6:15 AM
Before drivers arrive
Your CMMS dashboard shows all 50 buses green — except Bus #27, which is flagged amber for a coolant pressure trend that suggests a water pump bearing is degrading. Estimated failure window: 10–18 days.
6:45 AM
DVIR inspections complete
Drivers tap through digital pre-trip inspections on their phones. Two minor defects auto-create work orders — one assigned to afternoon crew, one to next-day. No paper. No phone calls. No re-entry.
9:30 AM
Shop crew reviews AI-generated priority list
Bus #27 water pump part is already on order — the system checked inventory, found zero stock, and created a PO three days ago. Scheduled for Wednesday repair during a natural gap in the route schedule.
2:00 PM
PM work orders complete for the day
Three buses got scheduled PM service today based on actual mileage triggers — not "we think it's about time." Each work order auto-closed with labor hours, parts used, and next service date calculated.
4:30 PM
Daily report auto-generated
Fleet health score: 94%. Cost per mile trending down 12% over 90 days. Zero unplanned breakdowns this week — for the fourth consecutive week. The report emails itself to the transportation director.
That's Level 3. No drama. No surprises. No 6 AM phone calls from a driver on the side of the road. Just a bus fleet that runs like it's supposed to — because the system sees problems before humans can.
Book a demo and we'll walk through this exact scenario with your fleet data
05
The 6 KPIs That Prove You've Reached Level 3
You can't claim you're at Level 3 if you can't measure it. These are the six metrics that separate AI-driven fleets from everyone else — and the benchmarks you should be hitting.
<5%
Unplanned Downtime
L1 average: 25–35%
$0.08
Cost Per Mile
L1 average: $0.25–$0.45
95%+
PM Compliance Rate
L1 average: 40–60%
97%+
Fleet Availability
L1 average: 80–85%
14–28 days
Failure Prediction Lead Time
L1: 0 days (after the fact)
3–6 mo
Time to Positive ROI
First prevented failure pays for the system
The Bottom Line
In 2026, 65% of fleet operators say they plan to adopt AI maintenance — but only 27% have actually done it. That gap is closing fast, and the fleets that move first are locking in structural cost advantages that compound over every year of operation. A 50-bus district saves approximately $240,000 annually by reaching Level 3. The software costs a fraction of that.
The path is clear: digitize your maintenance operations (Level 1 → 2), connect your telematics data (Level 2 → 2.5), and let AI do what humans can't — predict which bus will fail, which component is degrading, and which work order should be generated today. You don't need a data science team. You need a CMMS that was built to take you there.
BusCMMS is the only fleet maintenance platform designed specifically for bus operations that provides a complete Level 1 → Level 3 journey in a single system — digital inspections, automated PM, telematics integration, fault code ingestion, and AI-driven predictive alerts, all with school bus workflows pre-built.
Sign up free and take the first step from reactive to predictive today
Frequently Asked Questions
How long does it take to get from Level 1 to Level 3 AI maintenance?
With a purpose-built platform, most bus fleets reach Level 2 (preventive) within 30–60 days and Level 3 (predictive AI) within 90–180 days. The key accelerator is starting with a CMMS that has school bus workflows pre-built — templates, PM schedules, and telematics connectors that work out of the box. Districts that have to build custom inspection forms and configure integrations from scratch add 60–90 days to that timeline. AI accuracy reaches 90%+ by month two as models learn your specific fleet patterns.
Do I need to buy IoT sensors or new hardware for AI maintenance?
Usually not. Over 90% of buses manufactured after 2015 already broadcast diagnostic data through factory-installed telematics. If you're running Samsara, Geotab, Zonar, or Verizon Connect, you already have the sensor data AI needs. BusCMMS has pre-built connectors for all major telematics providers — no custom API development required. For older buses without telematics, basic OBD-II adapters start at $15–25/vehicle and provide enough data for meaningful predictive analysis.
What's the ROI of AI predictive maintenance for a school bus fleet?
A 50-bus district typically saves $200,000–$240,000 annually by reaching Level 3. The math is straightforward: emergency repairs drop 62%, parts costs fall as rush shipping is eliminated, overtime labor decreases, and fleet availability climbs above 97%. Industry data shows 10:1 to 30:1 ROI within 12–18 months. Bus fleets specifically see positive ROI in 3–6 months — the first prevented breakdown often covers the entire annual software cost.
Will my mechanics resist AI maintenance tools?
This is the most common concern — and the most overblown. The districts that succeed frame AI as "giving your best mechanic a crystal ball," not "replacing your mechanics with a computer." AI flags risks. Mechanics still diagnose and fix. The difference is they're working on planned repairs during regular hours instead of emergency calls on weekends. Start with your top 2–3 mechanics as champions. When they see the system predict a failure they didn't catch, adoption spreads fast. Leadership reviewing analytics weekly also doubles the speed of adoption.
Can a small district (20–30 buses) benefit from AI maintenance?
Absolutely — and often more than large districts. Smaller fleets see higher percentage ROI because a single prevented breakdown has outsized impact on tight margins and limited spare buses. If you have 25 buses and 1 spare, every unplanned breakdown disrupts routes. AI that prevents even one breakdown per month changes your entire operation. Modern CMMS platforms like BusCMMS start at accessible price points with no minimum fleet size, and the first prevented failure typically pays for the system for the entire year.







