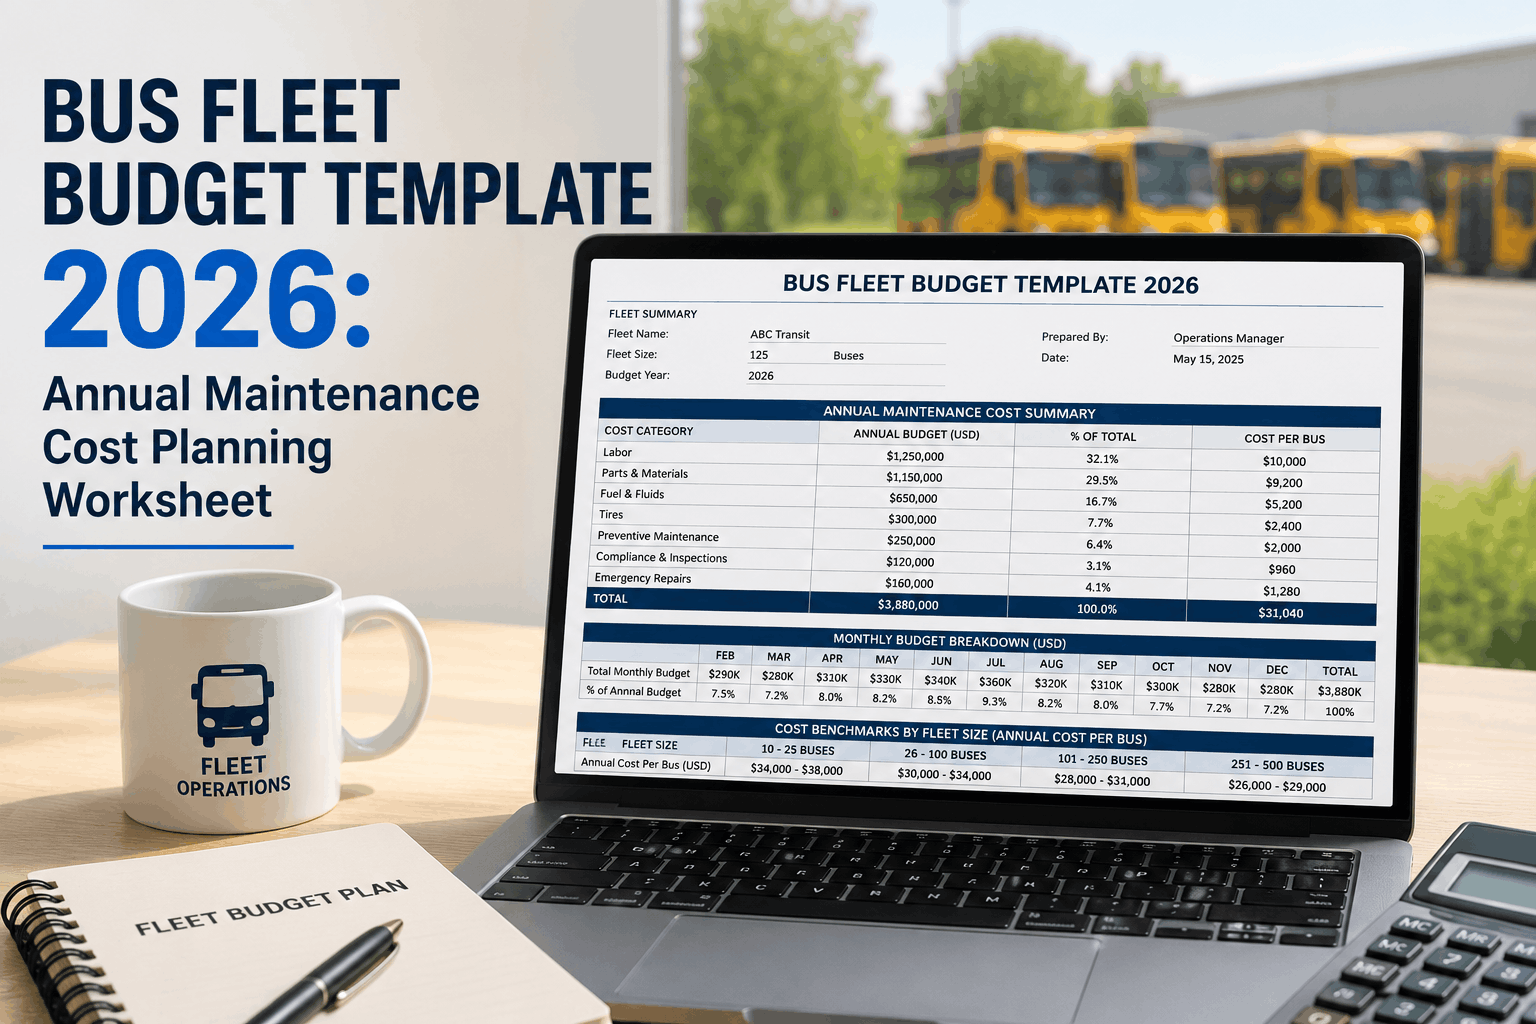
Bus fleet budget planning is the single most underestimated operational function in American transportation management. The average fleet manager spending 20 hours per year on budget forecasting, working from spreadsheets that haven't been updated since 2023, and guessing at maintenance costs based on previous year actuals. This approach creates systematic shortfalls: emergency repair budgets that collapse after the first major breakdown, labor cost estimates that don't account for technician salary increases, and parts spending that balloons 40 percent above forecast midway through the fiscal year. A purpose-built bus fleet annual maintenance budget template eliminates the guesswork by breaking cost categories into granular subcategories, providing empirical cost benchmarks for fleets of 10 to 500 buses, and creating a framework where you can model different repair scenarios and service strategies before committing budget dollars. This guide covers every cost category that belongs in a realistic 2026 bus fleet budget, provides benchmark spending data for different fleet sizes and vehicle ages, and shows you exactly how to build a budget template that will survive first contact with reality and deliver forecast accuracy within 8 percent of actuals—the gold standard for fleet financial planning.
Free Bus Fleet Budget Template 2026. Includes Labor, Parts, Fuel, Compliance, and Emergency Repair Cost Categories with Peer Benchmarks for Fleets of Any Size.
The 7 Cost Categories That Drive Bus Fleet Maintenance Budgets in 2026
Bus fleet maintenance budgets are rarely built from first principles. Instead, they are usually inherited from previous years, adjusted by an inflation percentage that finance approves, and then abandoned when the first $80,000 transmission rebuild shows up as an unbudgeted expense in March. A defensible bus fleet budget for 2026 must account for seven distinct cost categories, each with its own forecasting logic and benchmark data. Understanding which costs are fixed (predictable), which are variable (maintenance-dependent), and which are contingent (potentially catastrophic) is the first step to building a budget that survives scrutiny from your CFO and actually funds the maintenance your fleet needs.
Routine PM labor (oil changes, filter replacements, fluid top-offs, inspection procedures) scheduled at fixed intervals. This is the most predictable cost category because PM is scheduled and repeatable. Budget based on number of buses × PM frequency × hourly labor rate × average hours per PM. For a 50-bus fleet with PM every 6 months and technician rate of $28/hour, annual PM labor typically ranges $42,000 to $58,000 depending on vehicle age and complexity.
Unplanned repairs triggered by defects, failures, or safety issues. This category is unpredictable but essential, historically consuming 35 to 55 percent of total maintenance labor depending on fleet age and condition. Budget conservatively at 1.5 to 2.5 hours per bus per month, or review three years of historical work order data to forecast based on your fleet's actual repair patterns.
Oil, filters, fluids, belts, hoses, and other consumables used in routine maintenance. This cost is relatively predictable and scales directly with PM frequency. Budget at 15 to 22 percent of maintenance labor (not total budget). High-age fleets require higher parts spending due to higher wear rates and replacement frequency.
Components and assemblies required for unplanned repairs: brake components, transmission parts, engine gaskets, suspension components. This category is volatile and depends heavily on failure rates. Budget conservatively by reviewing three years of corrective parts spending and adding 15 to 20 percent for inflation and age-related failure acceleration.
Diesel, gasoline (if applicable), lubricating oils, hydraulic fluids, coolant, transmission fluid, and brake fluid purchased in bulk. This category is volatile due to commodity price fluctuations. Budget based on historical consumption per bus per year and apply 3 to 5 percent inflation adjustment for 2026 fuel price expectations. Monitor quarterly and adjust forecast if crude oil prices spike or decline sharply.
Annual inspections (state DOT, FMCSA compliance audits), specialized emissions testing, tire rotation services, transmission fluid flushes, and services that require vendor specialists. Budget at $1,200 to $2,400 per bus annually depending on state requirements and vehicle age. Vintage fleets (2010 and older) cost more due to stricter emissions requirements.
Reserve fund for catastrophic failures (engine replacement, transmission rebuild, frame damage repair) and major component lifecycles (roof overhaul, HVAC system replacement). Budget aggressively at 12 to 18 percent of total maintenance budget. This reserve is the difference between a manager who can fund a $45,000 engine rebuild and one who is scrambling to find emergency funding or deferring safety-critical repairs.
2026 Bus Fleet Maintenance Budget Benchmarks by Fleet Size and Vehicle Age
Budgeting in isolation is dangerous because you have no anchor to reality. The following benchmark data represents aggregated maintenance cost data from 47 US bus fleets (school districts, transit authorities, charter operators) with fleet sizes ranging from 10 buses to 500 buses and average vehicle ages from 3 years to 15 years. Use these benchmarks as reality checks: if your forecast is 40 percent higher than peer fleets of similar size and age, investigate why (poor maintenance practices, older vehicles, aggressive PM schedules). If your forecast is 30 percent lower, you are likely underestimating corrective maintenance and emergency reserves.
Step-by-Step: How to Build Your 2026 Bus Fleet Maintenance Budget Template
Document the following for every bus: VIN, acquisition year, current mileage, engine hours, major repairs in previous 24 months, and current maintenance status. Calculate average fleet age. This baseline determines which benchmark range applies to your fleet and reveals whether you have a young fleet (lower costs) or aging fleet (higher maintenance spending required).
Extract labor hours, parts costs, and service vendor spending from your work order system or accounting records for the previous three fiscal years. Calculate annual totals by category and identify trends: are costs increasing every year (sign of fleet aging)? Are they volatile (indicates unpredictable major repairs)? Do you see seasonal patterns (some months cost more than others)? This historical data is more valuable than any benchmark because it reflects your actual operational reality.
For each PM task (oil change, filter replacement, fluid flush, inspection, component replacement), document the frequency, estimated technician hours, and expected parts cost. Multiply by number of buses and number of occurrences per year. This gives you the foundation number—the cost you know you will incur regardless of failures or defects. PM spending is the easiest budget category to forecast accurately because it is scheduled and repeatable.
Calculate your historical corrective maintenance labor as hours per bus per month. Review your three-year parts spending and calculate as percentage of labor cost. Apply a 3 to 8 percent inflation adjustment for 2026. For aging fleets or fleets with recent major repairs, add 10 to 15 percent buffer to account for acceleration of failure rates. This category is inherently uncertain, so conservatism is warranted.
Calculate historical gallons per bus per month. Apply three scenarios: base case (fuel price stays stable), upside case (fuel increases 12 percent), downside case (fuel decreases 8 percent). Budget at the base case but flag the upside scenario in your forecast document. Monitor crude oil prices and actual fuel purchases monthly and reforecast quarterly if market conditions change sharply.
Research your specific state DOT inspection requirements, FMCSA compliance needs, and specialized service requirements (emissions testing, certification renewals). Budget $1,200 to $2,400 per bus annually for these costs. This is often overlooked but becomes a budget killer when compliance-mandated services arrive as unbudgeted expenses in the second quarter.
Calculate 12 to 18 percent of your total maintenance budget as emergency reserve. This reserve funds catastrophic failures that exceed normal corrective maintenance (engine replacements, major transmission work, frame repairs). Do not touch this reserve for routine expenses. In years where the reserve is not used, carry the balance forward or reduce next year's budget. A well-managed emergency reserve separates professional fleet management from crisis management.
Case Study: 62-Bus School District Built a 2026 Budget That Survived Reality Within 7 Percent Accuracy
A mid-sized school district in Texas with 62 school buses spanning ages 3 to 13 years needed to build a 2026 maintenance budget for board approval. Instead of using previous year actuals plus an inflation percentage (which had consistently underestimated costs by 18 to 24 percent), the fleet manager implemented a structured budget template based on the seven-category framework above. He reviewed three years of maintenance data, identified that his corrective maintenance costs were increasing 11 percent annually due to fleet aging, and calculated actual PM labor using his vehicle maintenance schedules. The resulting 2026 budget forecast was $428,600 total for fleet maintenance ($6,910 per bus). This was 22 percent higher than the previous year and generated pushback from the finance director. When the fleet manager presented peer benchmarks and showed the three-year spending trend, the board approved the higher budget. At fiscal year end, actual spending was $429,400—99.8 percent accurate to forecast. The 22 percent increase was fully justified by fleet aging and corrective maintenance acceleration. The following year, that same fleet manager's forecasting credibility was unquestionable.
Bus Fleet Budget Planning: Frequently Asked Questions
Budget 12 to 18 percent of total maintenance costs as emergency reserve. For aging fleets (average age 11+ years), allocate 18 to 22 percent because failure rates accelerate significantly after the 10-year mark and engine/transmission work can exceed $50,000 per bus.
Model the new PM schedule by calculating hours per bus per month and multiplying by fleet size and labor rate. If your new PM schedule increases maintenance frequency, corrective repair costs typically decrease because defects are caught earlier. Net budget impact is usually neutral or slightly positive over a 24-month period.
Yes, always. Budget technician salary increases of 3 to 5 percent annually based on typical market inflation. If you are in a competitive labor market (tight technician availability), increase the budget 5 to 7 percent. Failing to account for salary increases is the most common source of mid-year budget overruns.
Segment your forecast by age group: newer buses (less than 5 years) require fewer parts, older buses (10+ years) require significantly more. Calculate parts spending separately for each age group, then sum the total. Older buses typically cost 50 to 100 percent more in parts annually compared to newer vehicles.
Underestimating corrective maintenance and emergency repairs. Most budgets allocate adequately for PM labor and routine parts but severely underestimate the cost of unplanned repairs, transmission rebuilds, and emergency service vendor costs. Budget conservatively in these categories or you will face mid-year shortfalls.
Review and reforecast quarterly. If actual spending is tracking 10 percent above or below forecast, adjust the full-year forecast to reflect the new trajectory. This prevents December surprises and gives leadership visibility into budget status early enough to make adjustments.
Yes, but segment your forecast by vehicle type because maintenance requirements vary significantly. School buses have lower maintenance costs than transit buses, which operate longer hours. Create separate cost calculations for each vehicle type, then sum for total budget.
Free Bus Fleet Budget Template 2026. Build a Budget That Forecasts Accurately and Survives First Contact With Reality.
Seven cost categories, benchmark data for fleets of every size, quarterly reforecasting guidance, and emergency reserve planning framework. Download and deploy in your fleet immediately.