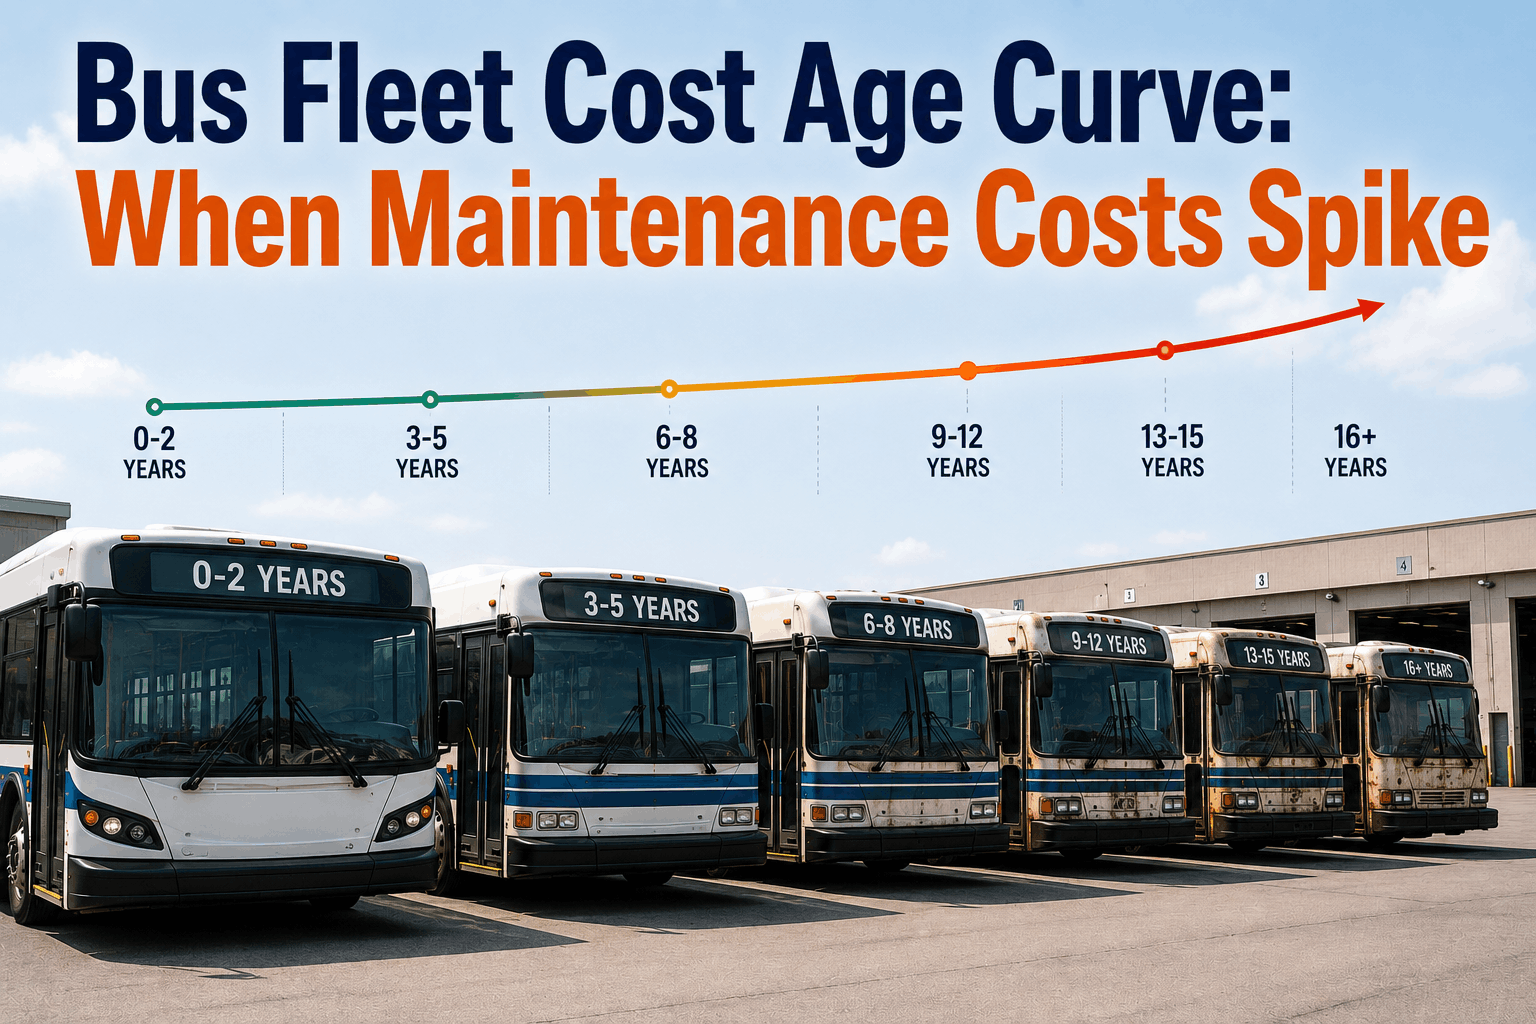
Managing capital expenses in transit or school bus operations reveals a fundamental truth: asset maintenance costs do not scale in a clean, linear fashion. For the first few years of a new vehicle's operational lifecycle, maintenance budgets remain low, insulated by manufacturer warranties and fresh, factory-grade components. However, as an asset passes critical mileage milestones, fleet managers encounter a steep, non-linear phenomenon known as the bus fleet cost-age curve. Between years four and seven, vehicle wear-and-tear shifts from routine oil changes and brake pad swaps to complex powertrain overhauls, major electrical harness rebuilds, and expensive emissions system replacements. Treating an aging fleet with the same static financial projections used for new deliveries leads to overdrawn budgets, unexpected road calls, and prematurely sidelined assets. Navigating this predictable financial cliff requires a data-driven transition away from reactive patching and toward proactive, age-segmented asset lifecycle management. This comprehensive guide breaks down the core mechanical friction points of the cost-age curve, analyzes specific operational risk windows, and outlines an actionable framework to use CMMS analytics to forecast capital replacement cycles with absolute precision.
Cost & ROI
Bus Fleet Cost Age Curve: When Maintenance Costs Spike
Vehicle maintenance costs do not rise evenly—they accelerate sharply as assets age. Learn to spot the inflection points on the bus fleet cost-age curve and build an optimized capital replacement roadmap.
Why Fleet Maintenance Costs Follow a Non-Linear Curve
Understanding why costs accelerate rapidly requires analyzing how major heavy-duty vehicle systems age under constant daily service. When multiple core components reach their engineering wear limits at the exact same time, operations experience a compounding financial impact on the shop floor.
Reason 1: Expiring OEM Warranty Safety Nets
During a bus's first 36 months, bumper-to-bumper or powertrain warranties shield the fleet from major repair bills. Once these warranties expire, the full financial burden of complex system repairs shifts entirely to your internal operating budget.
Reason 2: Compounded Subsystem Component Fatigue
Major heavy-duty components—including turbochargers, steering gearboxes, air compressors, and cooling modules—have overlapping Mean Time Between Failures (MTBF) that typically trigger around the 150,000 to 200,000-mile mark.
Reason 3: Exhaustion of Aftertreatment/Emissions Systems
Diesel Particulate Filters (DPFs), Selective Catalytic Reduction (SCR) systems, and specialized alternative-fuel regulators experience heavy thermal stress. Midlife degradation requires deep chemical cleaning or complete system replacements.
Reason 4: Accelerated Cumulative Structural Wear
Years of enduring rough city streets, heavy passenger passenger loads, and road salt cause structural fatigue. Sub-frame corrosion, suspension bushing collapse, and loose interior body paneling require time-consuming, expensive structural remediation.
The Strategic Milestones of Lifecycle Cost Forecasting
To build an accurate lifecycle plan, fleet managers must separate their assets into clear age groups, treating each stage of the lifecycle with a unique preventive maintenance strategy and budget projection.
Lifecycle Wear Horizons vs. Financial Vulnerabilities
Phase: Years 1 to 3 (The Baseline Horizon)
Maintenance is predictable and strictly limited to standard fluid swaps, filter changes, and routine tire rotations. Operational focus centers on capturing clean baseline inspection data and tracking early warranty claims.
Phase: Years 4 to 5 (The First Component Cliff)
Operating costs trend sharply upward as factory components wear thin. Shops encounter frequent alternator swaps, brake caliper replacements, cooling line leaks, and initial emissions sensor faults that demand immediate attention.
Phase: Years 6 to 7 (The Midlife Overhaul Peak)
The absolute peak of the cost-age curve. Buses require heavy capital investments, including transmission rebuilds, differential reseals, DPF assembly replacements, and steering linkages, testing shop capacity and budget limits.
Phase: Year 8 and Beyond (The Terminal Dilemma)
Vehicles enter an unpredictable phase where emergency breakdown costs outpace the residual value of the bus. Management must decide whether to invest in intensive life-extension work or decommission the asset entirely.
The Fix: Automating Lifecycle Management inside Your CMMS
Stop trying to chart asset depreciation curves on static paper files. Build an automated lifecycle cost matrix directly inside your centralized fleet management platform:
1
Group Fleet Assets by Age and Purchase Vintage
Organize your vehicles into distinct age cohorts within your CMMS. Grouping buses by vintage allows you to isolate and compare historical repair trends between old and new model generations.
2
Track Total Cost of Ownership (TCO) Metrics Automatically
Program the software to calculate every dollar spent on parts, internal mechanic labor, commercial sublet vendors, and towing fees, attaching the data directly to the vehicle's unique VIN.
3
Deploy Proactive, Predictive Replacement Intervals
Use your historical data to schedule midlife component replacements before a failure occurs. Changing high-risk components during routine scheduling prevents expensive road calls and keeps assets moving.
4
Set Automatic Lifecycle Threshold Failsafe Alerts
Configure custom financial alerts within the platform. The system will flag any vehicle whose trailing 12-month maintenance costs cross a specific percentage of its replacement value, identifying capital replacement candidates.
"We used to assume our transit fleet maintenance costs rose linearly by about five percent each year. That oversight left our budget short when a large group of our transit buses hit their sixth year in service. Suddenly, we were hit with a massive wave of transmission failures and DPF replacements that completely broke our budget. Moving our operational data onto an automated CMMS platform allowed us to map our true cost-age curve with precision. Now, we spot the exact months where maintenance expenses begin to spike, schedule our midlife overhauls proactively, and present clean, data-backed fleet replacement budgets directly to our executive board."
— Chief Financial Officer, Regional Transit Authority, Michigan
Flatten the Cost-Age Curve and Optimize Fleet ROI
Take control of escalating maintenance costs before they impact your balance sheet. Predict part failures, automate TCO reporting, and make smart capital replacement decisions using an advanced fleet management platform.