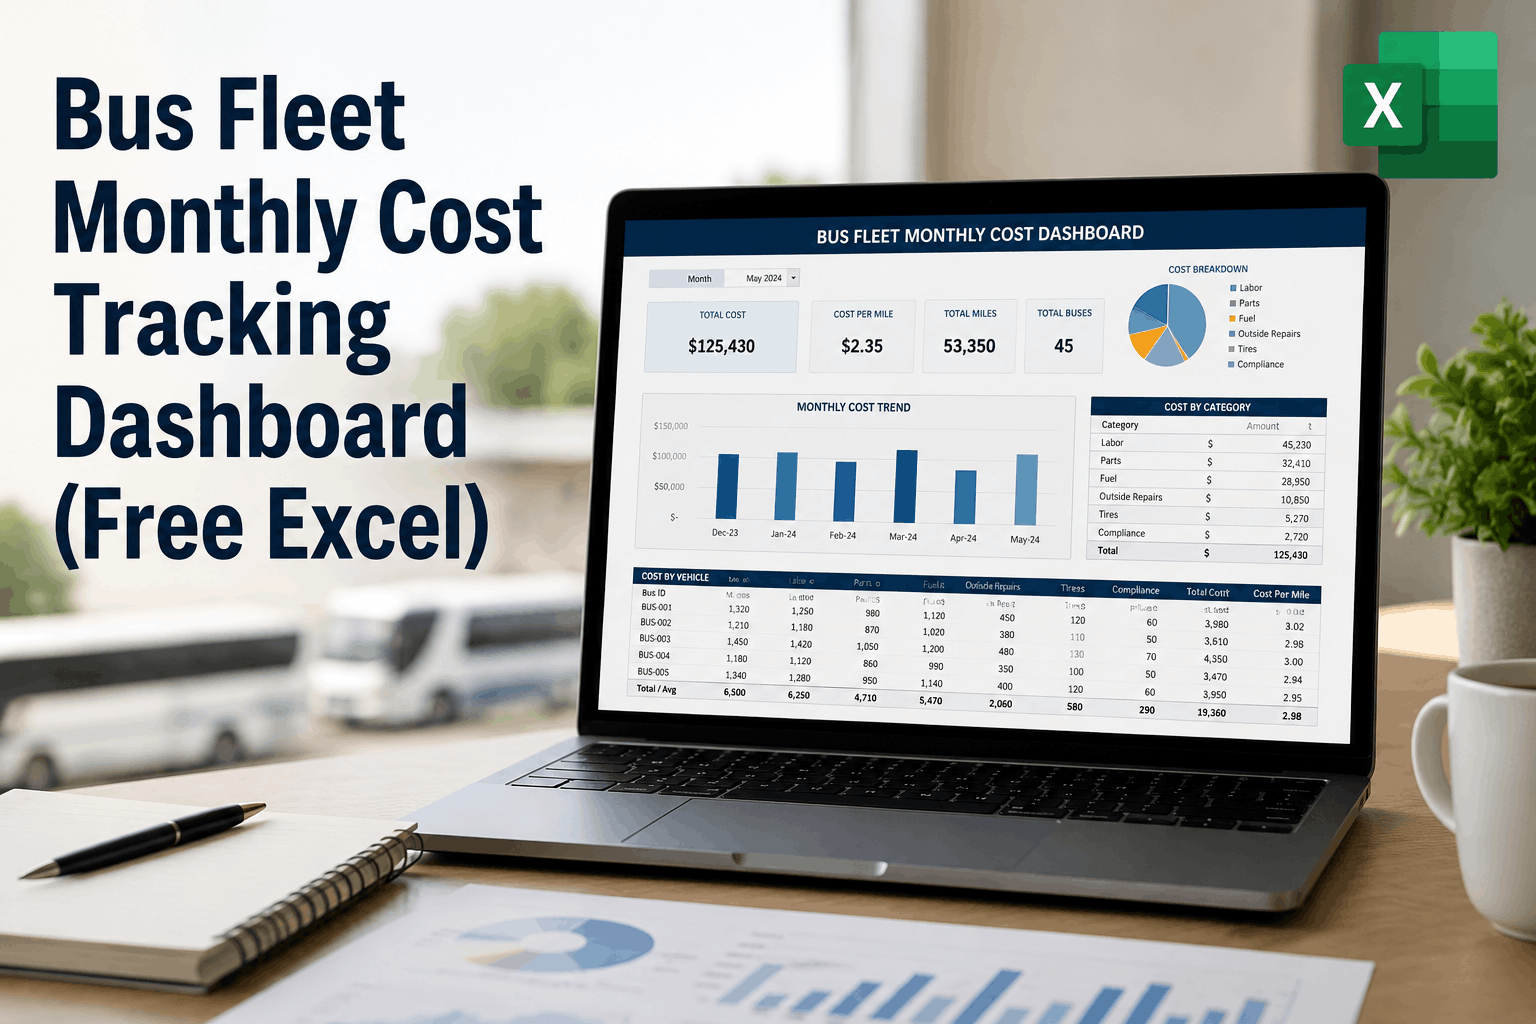
A 94-bus Ohio transit authority knew their annual maintenance budget was $2.1 million. What they did not know was that 15 specific buses were consuming 43% of that budget — $903,000 — while the remaining 79 buses split the other $1.197 million. Without per-vehicle cost tracking, the budget looked fine. Fleet-wide averages showed $22,340 per bus, which was within range. Nobody flagged it. Nobody retired the money-pit buses. Nobody redirected maintenance resources toward the vehicles that needed it most. The first time that data surfaced was when a consultant ran three months of work orders through a spreadsheet and mapped costs back to VINs. The analysis took 11 days. Six of those 15 buses were immediately flagged for retirement review. The annual maintenance savings after acting on the data: $280,000. The reason nobody had that data sooner: no cost center structure in their maintenance system. Every repair posted to one fleet-wide expense line. That is what fleet-wide averages hide — and it is why per-vehicle cost centers in your CMMS are not an accounting preference. They are the financial foundation of every bus replacement, budget defense, and vendor negotiation your operation faces.
Bus Fleet Cost Centers in CMMS: How to Track Labor, Parts, Fuel, and Repair Costs Per Vehicle
Per-vehicle cost center configuration in BusCMMS gives leadership true per-asset economics — not fleet-wide averages. Here is how to set up labor, parts, fuel, and outside repair cost tracking by vehicle, depot, and route so every budget decision is backed by actual data.
VEHICLE COST CHANGES
- consuming disproportionate spend 15% of fleet = 43% of budget
- reduction — CMMS cost tracking 25–35%
- vehicles over 10 yrs — share of spend 33.5%
- ROI window — per-vehicle tracking 4–8 months
The Problem With Fleet-Wide Cost Averages — And Why They Cost You More
Fleet-wide cost averages are the most dangerous number in bus fleet management. They look informative — $26,000 per bus annually, $0.58 per mile — and they satisfy the finance committee's question about where the maintenance budget goes. What they do not tell you is which specific buses are driving that average up, which routes produce the highest cost per mile, which depot has the most expensive labor utilization, and which five buses in your fleet should have been retired 18 months ago. Those answers require per-vehicle cost visibility, and per-vehicle cost visibility requires a cost center structure in your CMMS that captures every expense at the asset level — not just in aggregate.
The BusCMMS data on high-cost vehicle concentration is consistent across U.S. fleets of every size and type: approximately 15% of vehicles in a given fleet consume 40–50% of total maintenance spend. Without per-vehicle cost tracking, that concentration is invisible. The average looks acceptable. The budget appears managed. Meanwhile, three buses in your fleet have each absorbed $45,000–$60,000 in repairs over 24 months on vehicles worth $12,000 on the open market. The capital destruction is happening in plain sight — it just requires per-vehicle cost data to see it. Fleets that implement proper cost center tracking in their bus CMMS identify these vehicles within the first 90 days of data collection and make retirement or reallocation decisions that generate $150,000–$350,000 in annual savings for a 50–100 bus fleet.
Per-vehicle cost centers also change how fleet managers defend their budgets. A maintenance director presenting to a school board or transit authority with fleet-wide average data is asking leadership to approve spending based on numbers that hide as much as they reveal. A maintenance director presenting with per-vehicle cost center data — showing exactly which buses cost what, which routes generate the highest maintenance expense, and how this year's per-vehicle costs compare to last year — is making a data-driven case that is far harder to challenge and far more useful for the organization's capital planning. The cost center structure in your CMMS is the difference between those two conversations.
Understanding Cost Center Dimensions: Vehicle, Depot, Route, and Fund
A cost center is a defined unit of financial accountability — an entity to which expenses are assigned so that costs can be tracked, reported, and compared at that level. In bus fleet CMMS cost accounting, cost centers operate across four dimensions simultaneously, and understanding how to configure each dimension is the foundation of meaningful per-vehicle cost tracking. BusCMMS supports all four dimensions in its cost center architecture, allowing fleet managers and finance officers to slice maintenance cost data any way that serves their reporting and decision-making needs.
The vehicle dimension assigns every cost to a specific bus — by unit number and VIN. Every labor hour logged against Bus #42, every part issued from inventory for Bus #42, every outside repair invoice for Bus #42, and every fuel transaction by Bus #42 posts to that vehicle's cost center and accumulates its lifetime maintenance cost record. This is the primary cost center dimension and the one that drives replacement decisions, warranty recovery, and insurance claims. The depot dimension groups vehicle cost centers by physical location — allowing multi-site operators to compare maintenance cost per vehicle across depots, identify which facilities run the most efficient maintenance operations, and allocate shared overhead costs like shop supplies and equipment depreciation appropriately across locations.
The route dimension is particularly valuable for school districts and transit agencies where different routes produce different vehicle wear rates. A bus running a 45-mile rural route accumulates different maintenance costs than a bus running a 12-mile urban stop-and-go route — even if both buses are the same make, model, and year. Cost center tracking at the route level surfaces this relationship and informs both PM interval adjustments and route cost reporting. For school districts operating under federal grant programs — particularly Title I transportation funding or EPA Clean School Bus grants — the fund dimension ensures that maintenance costs for grant-funded vehicles post to the correct fund accounting line, satisfying the cost segregation requirements of federal grant compliance without manual allocation work at month end.
-
Vehicle Cost Center
Every expense tied to a specific bus by unit number and VIN. Drives replacement decisions and lifetime cost analysis.
Used for: Retirement decisions, warranty recovery, insurance, per-bus budget reporting
-
Depot Cost Center
Groups vehicle costs by facility. Compares maintenance efficiency across locations and allocates shared overhead.
Used for: Multi-site efficiency benchmarking, shop overhead allocation, facility budget reporting
-
Route Cost Center
Tracks maintenance costs by assigned route. Surfaces wear rate differences between urban and rural routes.
Used for: PM interval adjustment, route profitability, per-route budget analysis
-
Fund Cost Center
Segregates costs by funding source — general fund, Title I, EPA grant, bond fund — for compliance reporting.
Used for: Federal grant compliance, fund accounting, board-level budget reporting
Step-by-Step: Configuring Labor Cost Tracking Per Vehicle in BusCMMS
Labor is the largest single cost category in bus fleet maintenance — representing approximately 42% of total maintenance spend according to BusCMMS fleet data. It is also the cost category most commonly tracked inaccurately in manual systems, because capturing labor by vehicle requires technicians to log time against specific work orders, and work orders must be tied to specific vehicles. When technicians log time against a generic labor code — "maintenance hours" — with no vehicle reference, the data is financially useless for per-vehicle cost analysis. The average technician in a manual system spends only 58% of their shift on actual maintenance work (wrench time), with the remainder consumed by paperwork, parts retrieval, and administrative tasks. BusCMMS-managed fleets push wrench time to 80%+ through digital work order management — and as a byproduct, every minute of that wrench time is captured against the vehicle being serviced.
To configure labor cost tracking per vehicle in BusCMMS, each technician profile requires a loaded labor rate — their hourly compensation plus benefits, payroll taxes, and a proportional share of shop overhead. BusCMMS calculates loaded labor rates automatically once you enter base compensation and overhead allocation percentages during setup. When a technician opens a work order on their mobile device and logs time, the system multiplies their hours by their loaded rate and posts the labor cost to the specific vehicle's cost center in real time. No manual timesheet reconciliation. No end-of-month cost allocation exercise. The vehicle's labor cost updates the moment the work order closes.
For fleets with multiple technician skill tiers — journeyman mechanics, master technicians, certified inspectors — BusCMMS supports differentiated labor rates by technician, ensuring that a DOT inspection performed by a $68/hour certified inspector is not averaged with routine oil changes performed by a $44/hour journeyman. This rate fidelity matters for accurate cost-per-mile calculation and for work order cost estimation. When BusCMMS estimates the cost of an upcoming Class B service, it uses the assigned technician's actual rate — not a fleet-wide average — producing labor cost estimates accurate to within 5% of actual in BusCMMS fleet data across U.S. operations.
Labor Cost Visibility: Manual Tracking vs. BusCMMS Per-Vehicle Capture
Manual / Paper Timesheets
- Labor posted to fleet-wide cost line — no vehicle link
- Loaded rate calculation done manually at month end
- Wrench time averages 58% — rest is paperwork
- Per-vehicle labor cost requires 11+ days of analysis
BusCMMS Per-Vehicle Labor Capture
- Every labor hour posts to vehicle cost center at work order close
- Loaded rates auto-calculated per technician — real time
- Wrench time improves to 80%+ — digital work orders
- Per-vehicle labor cost visible in real time — zero analysis lag
Step-by-Step: Configuring Parts Cost Allocation Per Vehicle
Parts represent approximately 30–35% of total bus fleet maintenance spend and are the cost category most prone to misallocation in manual systems. When parts are pulled from inventory, the cost of those parts needs to post to the vehicle they were installed on — not to a general parts expense account. In manual inventory systems, parts are often expensed at the time of purchase rather than at the time of installation, which means the cost hits the budget in the wrong period and with no vehicle attribution. A transmission rebuild kit purchased in October for a repair completed in November appears as an October expense against no specific vehicle — useless for per-vehicle cost analysis and misleading for budget-period reporting.
BusCMMS resolves parts cost allocation through work-order-linked inventory management. When a technician pulls a part from inventory against a specific work order, BusCMMS immediately posts the cost of that part to the vehicle's cost center at the part's current valuation — either actual cost (FIFO) or weighted average cost depending on your configuration. The part is simultaneously deducted from inventory, the stock level is updated, and a reorder alert fires if the remaining quantity falls below your configured minimum. Every part pulled has a VIN, a work order number, and a timestamp — creating an unambiguous audit trail from parts receipt to vehicle installation.
For parts with high unit cost variability — brake components, emission system parts, engine components — BusCMMS supports vendor-specific pricing that reflects your actual contracted costs rather than list price. When your primary brake pad supplier offers a 15% fleet discount, that discount is built into the parts cost that posts to each vehicle's cost center. Your per-vehicle parts cost data reflects what you actually paid, not what the distributor's list price was. This distinction matters significantly for total cost of ownership calculations and for the make-versus-buy analysis your fleet director needs when deciding whether to bring certain outside repairs in-house.
See how BusCMMS inventory cost allocation integrates with QuickBooks and SAP
Step-by-Step: Fuel Cost Tracking Per Vehicle and Cost-Per-Mile Calculation
Fuel represents 20–25% of total bus operating costs and is simultaneously the most frequently tracked and least analytically useful cost category in most U.S. bus fleets. Fleets that use fuel cards track fuel spend — but they typically track it at the driver or card level, not at the vehicle level, and they rarely integrate fuel cost data with their maintenance cost data to calculate true cost per mile. Without vehicle-level fuel cost integration, cost per mile calculations are either impossible or grossly inaccurate, because fuel is the largest variable cost driver in that calculation and the one most sensitive to individual vehicle condition, route profile, and driver behavior.
BusCMMS fuel cost tracking connects directly to your fuel card system — integrating with major U.S. fuel card providers to pull transaction data automatically, match each transaction to the specific vehicle that fueled, and post the fuel cost to that vehicle's cost center. When Bus #31 fuels at a district pump or a commercial station, the transaction posts to Bus #31's fuel cost center automatically — no manual entry, no end-of-month reconciliation exercise, no guessing which card was used for which bus. BusCMMS then combines the vehicle's fuel cost with its maintenance cost and applies the odometer data from your telematics integration to calculate a true cost per mile for each vehicle, updated continuously as new costs post.
The Phoenix charter fleet case study documented in BusCMMS data shows what vehicle-level fuel tracking reveals: their cost center analysis found drivers spending $89,000 annually at non-contracted fuel stations — using the wrong fuel cards at stations with 12–18 cents per gallon premium pricing. That behavior was invisible in the fleet-wide fuel summary. It became visible the moment fuel costs were tracked at the vehicle level with the card transaction source identified. Per-vehicle fuel cost tracking also surfaces the maintenance-fuel efficiency relationship: buses with degraded injectors, worn air filters, or failing emission system components show elevated fuel cost per mile — often 6–12 months before those components produce a maintenance failure event. Catching rising fuel cost per mile is a predictive maintenance signal, not just an accounting data point.
Cost-Per-Mile Benchmark — U.S. Bus Fleet by Tracking Method
Annual maintenance + fuel cost per mile — school and transit bus segments
Source: BusCMMS fleet data, APTA Transit Fleet Management Reports, School Bus Fleet Magazine Industry Survey 2025–2026.
Outside Repair Cost Tracking: Vendor Invoices at the Vehicle Level
Outside repair costs — work performed by external vendors, body shops, transmission specialists, tire suppliers, and roadside assistance providers — represent a significant and frequently misallocated cost category in bus fleet financial tracking. In manual accounts payable processes, vendor invoices are posted to a "outside repairs" or "contracted services" general ledger account with no vehicle reference, making it impossible to know which bus consumed which portion of that annual spend. BusCMMS outside repair tracking ties every vendor invoice to the specific work order and vehicle that generated it — ensuring that the $4,800 transmission rebuild from your partner shop posts to Bus #17's cost center, not to a fleet-wide outside repair line.
The vehicle-level outside repair cost record is particularly valuable for two decisions: the make-versus-buy decision (whether to bring a repair type in-house versus continuing to outsource) and the replacement decision. A bus that has absorbed $18,000 in outside transmission and engine work over 36 months is a replacement candidate regardless of what its fleet-average maintenance cost says. Without the per-vehicle outside repair record, that $18,000 is invisible — spread across a $280,000 annual outside repair line with no attribution. With BusCMMS vehicle cost centers, every outside repair is linked to the bus, the work order, the vendor, and the date — and the cumulative record is available in a single screen for any vehicle in the fleet.
BusCMMS also tracks the ratio of in-house maintenance cost to outside repair cost per vehicle — a metric that flags buses that are consistently too complex or too specialized for your shop's capabilities and should be routed to specialty vendors, versus buses that are being sent outside unnecessarily when the repair could be handled in-house at 40–60% lower cost. For fleets managing tight maintenance budgets — which describes virtually every U.S. school district and regional transit authority in 2026 — this make-versus-buy visibility at the vehicle level is one of the highest-value outputs of a properly configured cost center structure.
Using Per-Vehicle Cost Data to Make the Replacement vs. Repair Decision
The most financially consequential decision a fleet manager makes is when to replace a vehicle rather than continue repairing it. Make that call too early and you spend capital on a replacement that the existing vehicle could have served. Make it too late and you spend $45,000 maintaining a bus worth $8,000 on the secondary market. The data that drives a sound replacement decision is per-vehicle lifetime cost — and it is only available if your cost center structure has been capturing costs at the vehicle level from the beginning.
BusCMMS replacement analysis pulls every labor, parts, fuel, and outside repair cost posted to a vehicle's cost center since its acquisition or since CMMS implementation, and compares the annual maintenance cost trend against two benchmarks: the vehicle's current estimated market value and the projected annual maintenance cost of a replacement vehicle for that use case. When a bus's annual maintenance cost exceeds 25–30% of its current market value for two consecutive years, it is statistically past its economic replacement threshold in the majority of U.S. fleet types. Without per-vehicle cost data, that threshold is impossible to calculate. With BusCMMS cost centers, it is a real-time dashboard metric visible to both the fleet director and the business officer.
Vehicles over 10 years old account for only 12% of miles driven in the average U.S. school bus fleet but consume 33.5% of total maintenance spend — a ratio that makes the retirement case mathematically obvious once the data is visible. BusCMMS lifetime cost reports surface these ratios per vehicle, support the capital replacement request to the board or transit authority, and document the projected savings from replacement versus continued operation. The 94-bus Ohio transit authority in our opening example used this exact data to justify retiring six high-cost vehicles, reducing annual maintenance spend by $280,000 — a result that required no additional maintenance resources, no new vendor relationships, and no operational changes. It required only the cost visibility that per-vehicle cost centers provide.
Replacement Signal Scorecard — Per Vehicle (BusCMMS Dashboard View)
Threshold: Replace signal triggers when annual maintenance cost exceeds 25–30% of current market value for two consecutive years. Data auto-populated from BusCMMS cost center records — no manual calculation required.
Connecting Cost Centers to Your Accounting System: GL Mapping in BusCMMS
Per-vehicle cost center data in BusCMMS is most valuable when it flows automatically into your accounting system — eliminating the manual cost allocation exercise that otherwise consumes 120+ hours of finance staff time annually in mid-sized U.S. bus fleets. BusCMMS integrates directly with QuickBooks, Sage, Oracle, SAP, NetSuite, and other major accounting and ERP platforms. The integration maps each cost category from BusCMMS to the correct general ledger account in your accounting system — labor to your payroll or contracted labor GL, parts to your parts and supplies GL, fuel to your fuel expense GL, outside repairs to your contracted services GL — with the vehicle cost center reference included in every posting.
GL mapping is configured once during BusCMMS setup. A 75-bus Ohio school district documented in BusCMMS case study data was spending 120 hours annually re-entering maintenance cost data from their CMMS into QuickBooks. After connecting the two systems and mapping GL accounts, that 120 hours dropped to near zero. The finance staff moved from data entry to actual financial analysis — comparing per-vehicle cost trends quarter over quarter, identifying which routes produced the highest maintenance cost per mile, and building the capital replacement projections the board needed for the next year's budget cycle. The data did not change. The staff time required to access it changed from weeks to seconds.
For school districts and transit agencies operating under fund accounting requirements, BusCMMS cost center GL mapping supports multi-fund posting — where a single work order's costs split across multiple fund accounts based on the vehicle's funding classification. An EPA Clean School Bus grant-funded electric bus posts maintenance costs to the grant fund account, while a general fund diesel bus posts to the general maintenance account. Both flow through the same BusCMMS cost center structure, both post automatically to the correct accounting fund, and both appear in fund-specific cost reports that satisfy federal grant reporting requirements without manual allocation work.
What Leadership Can See With BusCMMS Cost Centers — And What They Cannot Without
The executive and finance reporting gap between fleets with cost center tracking and those without is substantial. A fleet director presenting to a school board or transit authority board with fleet-wide average maintenance data can answer: how much did we spend on maintenance this year, and how does it compare to last year. A fleet director with BusCMMS per-vehicle cost center data can answer: which specific buses cost the most, which routes generate the highest maintenance expense per mile, which depot runs the most efficient maintenance operation, which cost categories are trending up and why, which vehicles are approaching economic replacement thresholds, and what the projected maintenance budget will be next year based on the current fleet's age and cost trajectory. Those are fundamentally different conversations — and only one of them positions maintenance as a strategic function rather than a cost center to be cut.
BusCMMS executive dashboard consolidates per-vehicle cost center data into the reports leadership actually uses: cost per vehicle ranked highest to lowest, cost per mile by bus and by route, budget versus actual by cost category and by vehicle, year-over-year cost trend by depot and fleet-wide, replacement signal list sorted by cost-to-value ratio, and projected future maintenance spend based on PM schedules and historical cost rates. For school districts, these reports generate directly in PDF format for board presentations. For transit agencies, they export in the format required by FTA National Transit Database reporting. The data is the same data your technicians are generating every day when they close work orders on their phones. BusCMMS just makes it visible to the right people in the right format at the right time.
Leadership Reporting: Fleet-Wide Average vs. Per-Vehicle Cost Centers
Without Cost Centers
- Annual spend total only
- Fleet-wide average cost per bus
- No per-vehicle cost ranking
- No cost-per-mile by vehicle
- No replacement signal data
- No depot efficiency comparison
- Budget requests based on averages
- 11+ days to produce vehicle analysis
With BusCMMS Cost Centers
- Every vehicle ranked by annual cost
- Real-time cost per mile per vehicle
- Cost trend by vehicle — year over year
- Budget vs. actual per vehicle + depot
- Replacement signal dashboard live
- Route cost analysis — highest to lowest
- Board-ready PDF reports in one click
- FTA and grant compliance reports instant
Frequently Asked Questions: Bus Fleet Cost Centers in CMMS
-
What is a cost center in bus fleet CMMS and why does it matter?
A cost center is a defined unit — a vehicle, depot, route, or fund — to which every maintenance expense is assigned so costs can be tracked, reported, and compared at that level. Without cost centers, all fleet expenses pool into fleet-wide averages that hide which specific buses, routes, or depots are driving overspend — making it impossible to act on the data.
-
How does BusCMMS capture labor costs at the per-vehicle level?
When a technician logs time against a work order in BusCMMS, the system multiplies their loaded labor rate by the hours worked and posts the cost to that work order's vehicle cost center in real time. Every labor hour is tied to a specific VIN — no manual allocation, no end-of-month reconciliation, no data entry lag.
-
What is the typical cost-per-mile benchmark for well-managed U.S. bus fleets?
Industry average maintenance cost per mile for U.S. bus fleets runs $0.58–$0.85, with best-in-class fleets achieving $0.32–$0.48 per mile through CMMS-driven preventive maintenance and per-vehicle cost tracking. Fleets exceeding $0.70 per mile typically have significant optimization opportunity through retirement decisions and PM improvements.
-
How much of a fleet's maintenance budget is typically consumed by its highest-cost vehicles?
BusCMMS fleet data consistently shows that approximately 15% of vehicles in a given fleet consume 40–50% of total maintenance spend. Vehicles over 10 years old represent only 12% of miles driven but account for 33.5% of maintenance costs — a ratio that is invisible without per-vehicle cost center tracking.
-
Can BusCMMS cost centers support school district fund accounting requirements?
Yes — BusCMMS supports multi-fund cost allocation at the work order level, automatically posting costs to the correct fund account based on the vehicle's funding classification. EPA Clean School Bus grant vehicles, Title I transportation vehicles, and general fund vehicles all post to separate fund accounts without manual allocation work.
-
Does BusCMMS integrate with QuickBooks for automatic cost center posting?
Yes — BusCMMS integrates with QuickBooks Online, QuickBooks Desktop, Sage, Oracle, SAP, and NetSuite. Every cost center transaction posts automatically to the correct GL account with vehicle reference, fund code, and work order number — eliminating the 120+ hours of annual manual cost allocation that mid-sized fleets typically spend on this process.
-
When should a bus be replaced rather than repaired based on cost center data?
The standard replacement threshold is when a vehicle's annual maintenance cost exceeds 25–30% of its current market value for two consecutive years. BusCMMS tracks this ratio in real time on the replacement signal dashboard — automatically flagging buses that cross the threshold so fleet managers have the data ready for capital replacement requests.
-
How long does it take to configure cost centers in BusCMMS for a new fleet?
Most fleets complete the full cost center configuration — asset registry, cost category mapping, GL account setup, technician loaded rates, and accounting integration — in two to three business days during BusCMMS onboarding. Cost data begins accumulating immediately from the first work order closed after setup, with no manual retroactive allocation required.
-
Can BusCMMS generate board-ready per-vehicle cost reports for budget presentations?
Yes — BusCMMS generates PDF cost reports showing per-vehicle annual spend, cost-per-mile rankings, budget versus actual by vehicle and depot, year-over-year cost trends, and replacement signal summaries — all exportable in one click for board presentations, transit authority reviews, or grant compliance reporting without any manual data compilation.







