A 38-bus charter operator in Nashville, Tennessee spent eleven months convinced their maintenance budget was "roughly on target." They weren't tracking costs at the vehicle level — just writing a single monthly check to their parts supplier and eyeballing labor hours. When they finally sat down with their shop foreman and reconciled actual spend against revenue miles in Q3 2024, they discovered three buses — unit numbers 7, 14, and 22 — had consumed 61% of their total maintenance budget for the year. Bus 14 alone had triggered $34,800 in reactive repairs since January. None of it showed up as a problem in any report because there was no report. There was no cost tracking dashboard. There was no cost-per-mile calculation by vehicle. There was no way to see the variance between budgeted and actual spend until the annual tax filing landed on the accountant's desk. A structured bus fleet monthly cost tracking dashboard — one that captures labor, parts, fuel, outside repairs, and compliance costs at the vehicle level, calculates cost-per-mile automatically, and flags variance against budget — would have surfaced Bus 14 as a red-flag vehicle by February, not November. This guide delivers that dashboard: a complete, free Excel template built specifically for US bus fleet operations in 2026, covering every cost category that determines whether your fleet runs at a profit or bleeds margin silently. It is also the exact structure that Oxmaint imports directly — so when your fleet is ready to move from a spreadsheet to a live, automated cost intelligence platform, your data migrates in days, not months.
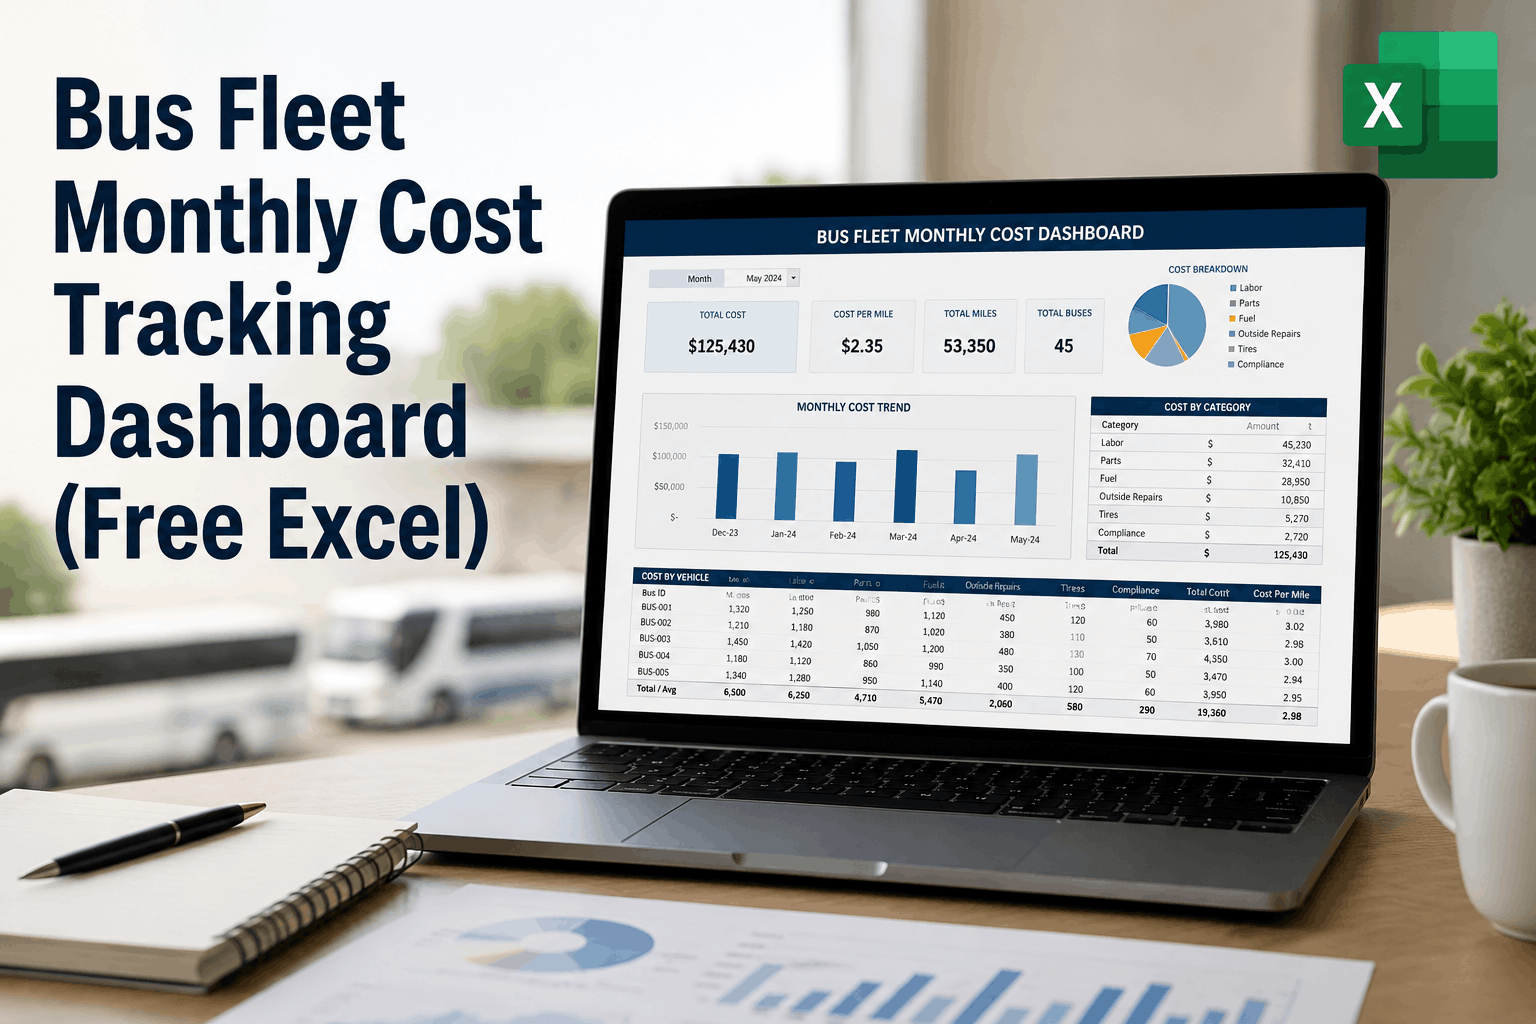
Bus Fleet Monthly Cost Tracking Dashboard: Free Excel Template With Cost-Per-Mile & Variance Reporting
A complete, free Excel cost tracking dashboard for US bus fleets — covering labor, parts, fuel, outside repairs, compliance, and admin costs by vehicle and by month. Auto-calculates cost-per-mile. Flags budget variance. Fully compatible with Oxmaint CMMS import for fleets ready to automate.
VEHICLE COST CHANGES
Most US bus fleet operators track costs the same way they have for decades: a combination of vendor invoices in a folder, labor hours written on a whiteboard, and fuel receipts in a shoebox. When budget review time comes, someone manually totals columns in a spreadsheet that was never designed for fleet cost analysis. The result is a single number — total monthly spend — that tells you almost nothing actionable. You cannot see which vehicles are draining budget. You cannot calculate cost-per-mile for individual units. You cannot identify whether your labor costs are 40% of spend or 60%. You cannot compare this month's parts cost against the three-month average to catch a trend before it becomes a crisis. The financial damage from this tracking gap is not abstract. According to the Federal Transit Administration's 2025 National Transit Database, school bus operations in the US spend an average of $26,000 per bus annually on maintenance — but the variance between the lowest-cost operators and highest-cost operators running the same bus types is 3.8x. That gap is not explained by vehicle age or route difficulty. It is explained by cost visibility. Fleets that track costs at the vehicle level, by category, month-over-month, and against budget, consistently outperform fleets that operate on aggregate spending intuition.
A properly designed bus fleet monthly cost tracking dashboard closes this gap by forcing discipline at the data entry level and delivering insight at the reporting level. When a technician closes a work order, labor hours get allocated to the vehicle, not just the shop. When a parts order arrives, it posts to the vehicle that consumed those parts, not a general fleet account. When an outside repair vendor submits an invoice, it ties to a unit number and a cost category. The dashboard totals all six cost categories by vehicle, by month, calculates cost-per-mile automatically using the miles field, and flags any category where actual spend exceeds budgeted spend by more than 10%. That flagging logic — simple as it is in Excel — transforms your monthly cost review from a backward-looking accounting exercise into a forward-looking operational intervention tool. You see the problem in Month 3, not Month 11.
The six cost categories that belong in every bus fleet monthly cost tracking dashboard are: technician labor (internal regular time + overtime), parts and materials (consumed on work orders), fuel (gallons × price per gallon by vehicle), outside repairs (vendor invoices for jobs completed externally), compliance costs (DOT inspections, CDL-related costs, regulatory fees), and administrative overhead (insurance allocation, registration, depreciation if tracked). Each category tells a different story about fleet health, and each has a different optimization lever. A dashboard that separates them gives you six different early-warning signals. A dashboard that lumps them into "total spend" gives you none.
What Your Competitors Know That You Don't — Cost Tracking Outcomes by Discipline Level
| Tracking Method | Cost Visibility | Avg. Cost Per Mile | Budget Variance Detection | Emergency Repair Ratio |
|---|---|---|---|---|
| No structured tracking | Fleet-wide only | $0.72–$0.85 | Discovered at year-end | 38–45% |
| Basic Excel spreadsheet | Category totals | $0.58–$0.72 | Monthly, manual review | 25–35% |
| This dashboard template | Per vehicle + category | $0.45–$0.60 | Auto-flagged at 10% variance | 18–25% |
| Oxmaint CMMS (automated) | Real-time, all layers | $0.32–$0.48 | Real-time alerts, any threshold | 8–14% |
Sources: APTA 2025–2026, FTA National Transit Database, Oxmaint Fleet Analytics Benchmarks
See Oxmaint's Live Cost Dashboard — Built for US Bus Fleets.
Oxmaint captures labor, parts, fuel, outside repair, and compliance costs at work order close — auto-calculating cost-per-mile, budget variance, and vehicle-level profitability in real time. No manual entry. No spreadsheet updates. Schedule a demo or contact our support team to see it configured for your fleet.
A bus fleet monthly cost tracking dashboard is only as useful as the categories it tracks. Too broad and the data hides problems. Too granular and no one updates it. Six cost categories represents the optimized balance — specific enough to surface actionable signals, broad enough to maintain without a dedicated accountant. Here is exactly what belongs in each category, what US benchmarks say about typical spend, and what an unusual reading in each category signals operationally.
Category 1: Technician Labor. This is your largest cost category — representing 38–45% of total maintenance spend across US bus fleets according to APTA 2025 fleet operations data. Track regular time and overtime separately. Regular technician labor runs $28–$52 per hour depending on market (higher in California, New York, Texas metros; lower in rural Southeast and Midwest). Overtime premium adds 50% to the base rate and is a budget leak that a well-structured PM schedule eliminates. Best-in-class fleets keep overtime below 8% of total labor hours. If your dashboard shows overtime consistently above 15%, your PM scheduling is reactive, not planned — and you are spending $6,000–$14,000 per year per bus above where you should be. Oxmaint's automated PM scheduling drives overtime below 7% in most fleets within 90 days of deployment by converting reactive call-ins to scheduled shop visits.
Category 2: Parts and Materials. Parts represent 28–34% of total maintenance spend. Track parts at the unit level — not as a fleet-wide purchase total. When Bus 7 consumes three alternators in six months, that signal only appears if parts are allocated to Bus 7's cost record, not pooled into a general parts account. US fleet benchmarks show best-in-class fleets spending $4,200–$6,800 per bus per year on parts; reactive fleets spend $9,500–$14,200 for the same vehicle types, largely because emergency sourcing carries a 3–5x price premium over planned procurement at contract rates. The dashboard template includes a "Rush Order %" column for parts — any vehicle showing rush orders above 20% of total parts events is a vehicle with a reactive maintenance problem, not a parts inventory problem.
Category 3: Fuel Cost. Fuel is typically the second-largest operating cost after driver wages — running $0.35–$0.65 per mile depending on vehicle type, route, and diesel price at the time of tracking. Track fuel at the unit level, not the pump level. Fuel consumption variance between identical buses on similar routes is an early indicator of mechanical issues — a bus burning 18% more fuel than its fleet average in Month 3 often has a cooling system, tire pressure, or transmission issue that will surface as a breakdown in Month 5 or 6. The dashboard template captures gallons consumed, miles driven, and average MPG by vehicle each month, flagging any unit more than 12% below fleet average MPG as a mechanical review candidate. This fuel variance monitoring capability — simple in Excel, automatic in Oxmaint — prevents breakdowns before they happen and catches fuel theft patterns that would otherwise go undetected.
Category 4: Outside Repairs (Vendor Invoices). Outside repairs — jobs sent to external shops, dealer service departments, specialty vendors, or roadside assistance providers — represent 12–18% of total maintenance spend in well-managed US fleets and 25–35% in reactive fleets. The difference is PM compliance. Fleets that complete 95%+ of scheduled preventive maintenance internally have fewer breakdowns requiring outside intervention. Every outside repair at emergency or retail rate costs 2.8–4.2x more than the equivalent internal repair at standard labor rates. The dashboard template tracks outside repair spend by vendor and by vehicle, identifying which vendors are most frequently used, which vehicles are most frequently sent out, and what percentage of total spend is flowing outside your shop. If outside repairs exceed 20% of total maintenance spend, you have a structural PM compliance problem that no spreadsheet can fix — but Oxmaint's automated scheduling can.
Category 5: Compliance Costs. DOT inspections, state-mandated vehicle inspections, CDL drug and alcohol testing program costs, ADA compliance maintenance for lift systems and accessibility features, and emissions testing fees all belong in this category. For school bus operators, add the costs of state-specific annual inspections, which vary from $40–$380 per vehicle depending on jurisdiction. For charter and transit operators, add FTA drug testing program administration costs, which average $180–$340 per driver annually. These costs are largely fixed and predictable — but they must be tracked against a budget to catch fee increases, added mandates, or compliance gaps that trigger fines. A DOT compliance violation fine averages $1,500–$11,000 per citation; out-of-service orders cost $800–$2,000 per day in lost revenue. Compliance cost tracking in your dashboard is an early warning system for under-investment in this category before regulators find it for you.
Category 6: Administrative and Overhead. Insurance allocation by vehicle, registration fees, license and permit costs, and shop overhead (utilities, tools, consumables not tied to a specific work order) complete the cost picture. Most US fleet managers undercount this category by 30–40% because it is rarely allocated at the vehicle level. A bus that has had two at-fault accidents in 24 months carries a materially higher insurance cost than a clean-record vehicle in the same fleet — but if insurance is tracked as a flat fleet-wide line item, that cost differential is invisible. The dashboard template includes a per-vehicle insurance allocation field and an administrative overhead percentage that distributes shop overhead proportionally by miles driven.
Cost-per-mile is the single most important financial metric in bus fleet management — and the most commonly miscalculated. Most US fleet managers who do calculate it make one of three errors: they use total miles including deadhead (non-revenue miles), they exclude one or more cost categories from the numerator, or they calculate it at the fleet level instead of the vehicle level. All three errors produce a number that looks useful but is operationally misleading. The correct formula is straightforward: Total Vehicle Maintenance Cost for the Period ÷ Revenue Miles Driven in the Period = Maintenance Cost Per Revenue Mile.
That formula sounds simple, but "total vehicle maintenance cost" must include all six categories tracked in your dashboard — labor, parts, fuel, outside repairs, compliance, and administrative allocation — or the cost-per-mile calculation understates true cost. A fleet manager who only includes parts and labor in their CPM calculation is typically understating actual cost-per-mile by 28–34%, which means every budget model built on that number is wrong by the same percentage. The dashboard template automatically sums all six cost categories into a "Total Cost" column and divides by the "Miles Driven" field to produce a per-vehicle cost-per-mile figure for the month, with a rolling 3-month average that smooths out single-month anomalies.
US benchmarks for bus maintenance cost-per-mile in 2026 vary significantly by fleet type. School buses average $0.52–$0.68 per mile for maintenance-only costs (excluding fuel and driver wages). Transit buses run $0.61–$0.79 per mile due to higher duty cycles and more frequent service intervals. Charter and motor coach fleets fall at $0.38–$0.55 per mile on average, reflecting fewer duty cycles per day. Best-in-class fleets in each category run 35–45% below these averages — not because they have newer vehicles (fleet age correlation is weaker than most managers assume), but because they have better PM compliance, lower reactive repair ratios, and structured cost visibility that catches high-cost vehicles early and intervenes before repair costs compound. Oxmaint automatically calculates cost-per-mile at the vehicle, route, and fleet level from live work order data — no manual input required. If you want to see where your fleet's CPM sits against these benchmarks, contact our team for a complimentary cost benchmark analysis using your actual fleet data.
Cost-Per-Mile Benchmarks — US Bus Fleets 2026
School Bus
$0.52–$0.68/mile
Best-in-class: $0.32–$0.41
Avg. 26,000 miles/yr per vehicle
Transit Bus
$0.61–$0.79/mile
Best-in-class: $0.38–$0.50
High duty cycle, 45,000+ miles/yr
Charter / Motor Coach
$0.38–$0.55/mile
Best-in-class: $0.24–$0.36
Lower duty cycle, 35,000 miles/yr avg
Paratransit / Shuttle
$0.44–$0.62/mile
Best-in-class: $0.28–$0.40
High stop-start, urban routes
Sources: APTA 2025–2026, FTA National Transit Database, Oxmaint Fleet Analytics
A cost tracking dashboard that only shows actuals is useful. A cost tracking dashboard that compares actuals against budget and flags variance is operationally transformative. The difference is whether you are running a history log or a management tool. The bus fleet monthly cost tracking dashboard template includes a budget column for each cost category and a variance column that calculates the difference between budgeted and actual spend — expressed both as a dollar amount and as a percentage. Any category where actual spend exceeds budget by more than 10% triggers a conditional formatting flag (red cell fill in Excel) that makes the overrun visible without requiring the fleet manager to hunt through rows of data.
Variance analysis is most powerful when it identifies patterns, not just individual overruns. A single month where outside repair costs run 22% over budget could be one unusual breakdown. Three consecutive months where outside repair costs exceed budget suggests a systemic PM compliance gap — buses are breaking down outside the shop because planned maintenance is being deferred. The dashboard template includes a trailing 3-month average for each cost category so variance trends are visible alongside current-month actuals. When the 3-month trend shows a category drifting upward while budget stays flat, that is the operational signal to investigate before the overrun becomes permanent.
The most financially dangerous variance pattern in bus fleet operations is not a single large overrun — it is a small, consistent monthly creep in parts and outside repair costs across multiple vehicles simultaneously. This pattern typically indicates a fleet aging issue: vehicles reaching the age where preventive maintenance costs are rising faster than budget assumptions, and reactive repairs are beginning to cluster. Identifying this pattern before it matures into a fleet replacement crisis requires exactly the kind of multi-vehicle, multi-month cost tracking the dashboard delivers. Oxmaint's automated variance alerting goes further — sending push notifications to fleet managers the moment any vehicle crosses a configurable threshold, without waiting for a monthly review cycle. To see how Oxmaint's real-time variance alerts work for your fleet size, schedule a demo with our team — most US fleets are live within 48 hours of signing up.
Monthly Variance Report — Sample Bus Fleet Dashboard Output
FLAG = >10% over budget | ALERT = >30% over budget | OK = within 10% of budget
"We had been running 24 buses for eight years and never once calculated cost-per-mile by vehicle. We thought we knew which buses were expensive — turned out we were completely wrong. Bus 9 was our 'reliable' unit. When we ran the numbers in the dashboard, Bus 9 was our third most expensive vehicle at $0.74 per mile. Bus 17 — the one everyone complained about — was actually at $0.51 per mile because it had been getting preventive attention. The dashboard didn't just show us our costs. It flipped our entire decision-making process upside down. We avoided replacing Bus 9 because of reputation and would have kept Bus 17 when it was actually performing better. After six months with the dashboard, we dropped total fleet CPM from $0.68 to $0.49. That's $247,000 annualized savings across our 24-vehicle fleet — from a spreadsheet."
The Excel dashboard template is a complete, functional cost tracking system for bus fleets operating 5 to 80 vehicles. It requires no software, no implementation project, and no IT support. You download it, populate your vehicle list, enter your budget figures, and start recording cost data. Within 30 days you will have the first month of per-vehicle cost-per-mile data your fleet has ever produced. Within 90 days you will have trend data. Within 6 months you will have enough history to make reliable budget projections and vehicle replacement decisions with actual data instead of gut feel. For many fleets, that is exactly where they need to be — and the Excel template delivers it completely.
For fleets ready to eliminate manual cost entry entirely, Oxmaint imports directly from the dashboard template format. Your vehicle list, cost category structure, and budget fields map field-by-field into Oxmaint's fleet cost module. After import, cost data flows automatically: when a technician closes a work order in Oxmaint's mobile app, the labor hours and parts consumed post to the vehicle's cost record in real time. Fuel transactions from integrated fuel card providers post automatically. Outside repair vendor invoices upload via the vendor portal and post to the correct vehicle. Compliance costs feed from inspection records. At the end of each month, Oxmaint generates the same dashboard report your Excel template produces — but with zero manual data entry, 97%+ cost accuracy, and real-time alerts instead of monthly reviews. The migration from Excel template to Oxmaint typically takes 2–3 business days for a fleet of up to 100 vehicles: data import, field mapping validation, a 45-minute team training session, and go-live. Most US fleets are capturing live cost data by Day 5.
What Oxmaint delivers that no Excel template can is cost intelligence that connects to operations. When outside repair costs spike for Bus 14, Oxmaint doesn't just flag the variance — it shows you the three deferred PM tasks that preceded the breakdown, the technician who approved the deferral, and the cost of those deferred items versus the emergency repair that followed. That causal visibility is what separates cost tracking from cost management. The Excel template gets you into cost tracking. Oxmaint gets you into cost management. Book a free demo or reach our support team to see how the migration works for your fleet size and budget.
Excel Template → Oxmaint: 5-Day Migration Path
Day 1
Data Import & Validation
Upload your Excel template. Oxmaint validates vehicle records, maps cost category columns, and flags any data quality issues for your review before import executes.
Day 2
Budget Configuration
Set monthly budget targets per vehicle and per cost category. Configure variance alert thresholds. Connect fuel card integration if applicable.
Day 3
Team Onboarding
45-minute virtual training session for your shop team. Technicians learn work order cost capture on mobile. Managers learn the cost dashboard and report exports.
Day 4
Go-Live
First live work orders close with automatic cost capture. Cost dashboard shows real-time data by Vehicle and by category. No manual entry required from Day 4 forward.
Day 5
First Report & Benchmark
Oxmaint generates your first cost dashboard report, benchmarks your CPM against US fleet averages by fleet type, and identifies your top 3 cost reduction opportunities automatically.
Start Tracking. Stop Guessing. Cut Costs by 25–35%.
Download the free Excel cost tracking dashboard and start producing per-vehicle cost-per-mile data immediately — or skip the spreadsheet phase and go directly to Oxmaint's automated cost intelligence platform. Either way, your bus fleet stops being a financial black box. Contact our support team for a personalized fleet cost assessment.
What is the correct formula for bus fleet cost-per-mile and which costs should I include?
Cost-per-mile = Total Maintenance Cost ÷ Revenue Miles Driven. Include all six categories: labor, parts, outside repairs, fuel (maintenance-allocated portion), compliance, and administrative overhead — excluding fuel and driver wages as separate line items tracked in your operating budget.
How often should we update the monthly cost tracking dashboard for it to be useful?
Update labor and parts at work order close (daily minimum), fuel weekly from pump records or fuel card reports, and outside repairs within 48 hours of vendor invoice receipt. Monthly updates produce a history log; weekly updates produce a management tool.
What is the US industry average for bus fleet maintenance cost per vehicle annually?
School buses average $22,000–$28,000 per vehicle annually; transit buses average $30,000–$38,000; charter and motor coach fleets average $18,000–$26,000. Best-in-class fleets in each category run 30–40% below these averages through preventive maintenance discipline and structured cost tracking.
Can this dashboard template work for mixed fleets with different bus makes and models?
Yes — the template includes a vehicle type and model field that allows you to filter cost data by fleet segment, compare CPM across vehicle types, and identify whether cost variances are model-specific or maintenance-practice-specific. Oxmaint handles mixed fleets natively with per-model PM schedules and cost benchmarking.
How do I set monthly budget figures if I have no prior cost tracking history?
Use US industry benchmarks as your starting point: $1,800–$2,400 per vehicle per month for school buses, $2,500–$3,200 for transit buses. After 3 months of actual tracking, replace estimates with your own fleet's actuals — your real numbers will be more accurate than any industry average for your specific operation.
What variance percentage should trigger a cost review for a specific vehicle or category?
Flag any single category over 10% above budget for review; escalate to an operational investigation at 25% variance; treat any vehicle with total cost variance over 30% as a candidate for a full maintenance audit within 30 days to identify root cause before costs compound further.
Should fuel costs for the bus fleet be tracked in the maintenance dashboard or separately?
Track fuel cost per vehicle in your maintenance dashboard to catch MPG variance that signals mechanical issues — but maintain a separate fuel operations budget for total fuel spend reporting. The maintenance dashboard uses MPG deviation as a leading indicator of breakdown risk, not as a fuel budget management tool.
How does Oxmaint's automated cost tracking differ from using this Excel dashboard template?
Oxmaint captures all six cost categories automatically at work order close — no manual entry — and delivers real-time alerts when any vehicle or category crosses your configured variance threshold. The Excel template requires manual updates and monthly review; Oxmaint delivers continuous monitoring and surfaces problems the same day they occur.
Is this template compatible with DOT compliance cost tracking requirements for US bus fleets?
Yes — the Compliance Cost category in the dashboard is structured to capture DOT inspection fees, state inspection costs, CDL drug testing program costs, and ADA compliance maintenance expenses separately from operational maintenance, providing a clean audit trail that satisfies FTA and DOT program review requirements.
The single most common financial mistake in US bus fleet operations is tracking cost at the wrong level of granularity. Fleet-wide monthly spend is an accounting number. Vehicle-level monthly cost-per-mile is a management number. The difference is that accounting numbers tell you what happened; management numbers tell you what to do next. A fleet manager who knows that Bus 22 has run $0.78 per mile for three consecutive months — versus a fleet average of $0.54 — knows exactly where to look, what to investigate, and which vehicle is a hold-versus-replace candidate. A fleet manager who only knows that total February spend was $47,200 knows essentially nothing actionable. The Excel dashboard template in this guide is a vehicle-level management tool. It is not perfect. It requires discipline to maintain, it cannot alert you automatically, and it cannot connect cost patterns to their operational root causes. But it delivers vehicle-level CPM data with six cost category breakdowns — which is 80% of the insight your fleet needs at zero software cost. Oxmaint delivers the remaining 20%: real-time automation, causal intelligence, and predictive analytics that prevent the cost overruns the dashboard merely reports. Start with the template. Graduate to automation when the value is clear — and it will be clear within 60 days.
A bus fleet monthly cost tracking dashboard is not a luxury for large transit authorities with dedicated finance teams. It is the minimum operational tool every US bus fleet — school district, charter operator, transit agency, paratransit provider — needs to stop operating in the financial dark. The free Excel template in this guide delivers vehicle-level cost-per-mile calculation, six-category cost breakdown, month-over-month trend tracking, and automatic budget variance flagging. It requires no software purchase, no implementation timeline, and no IT project. Download it, enter your vehicle list and budget figures, and start producing data-driven cost intelligence this week.
For fleets ready to eliminate the manual data entry burden and gain real-time cost visibility, Oxmaint imports directly from this template format and automates every cost capture workflow — labor, parts, fuel, outside repairs, compliance, and administrative overhead — at work order close, fuel card transaction, and vendor invoice receipt. The result is a live cost dashboard that updates in real time, sends variance alerts the day a problem surfaces, and connects cost patterns to the operational decisions that caused them. Most US fleets see full ROI within 90 days. Schedule a demo, start a free trial, or contact our support team — and stop letting your fleet's cost story go untold month after month.
Free Bus Fleet Cost Dashboard Template. Ready to Use. Ready to Upgrade.
Download the structured Excel cost tracking dashboard with six cost categories, auto-calculated cost-per-mile, and budget variance reporting — ready to use immediately. Or migrate to Oxmaint's automated cost intelligence platform whenever your fleet is ready. No credit card. No setup fees. Talk to our support team for a personalized onboarding plan.