bus-fleet-maintenance-cost-reporting-board-leadership

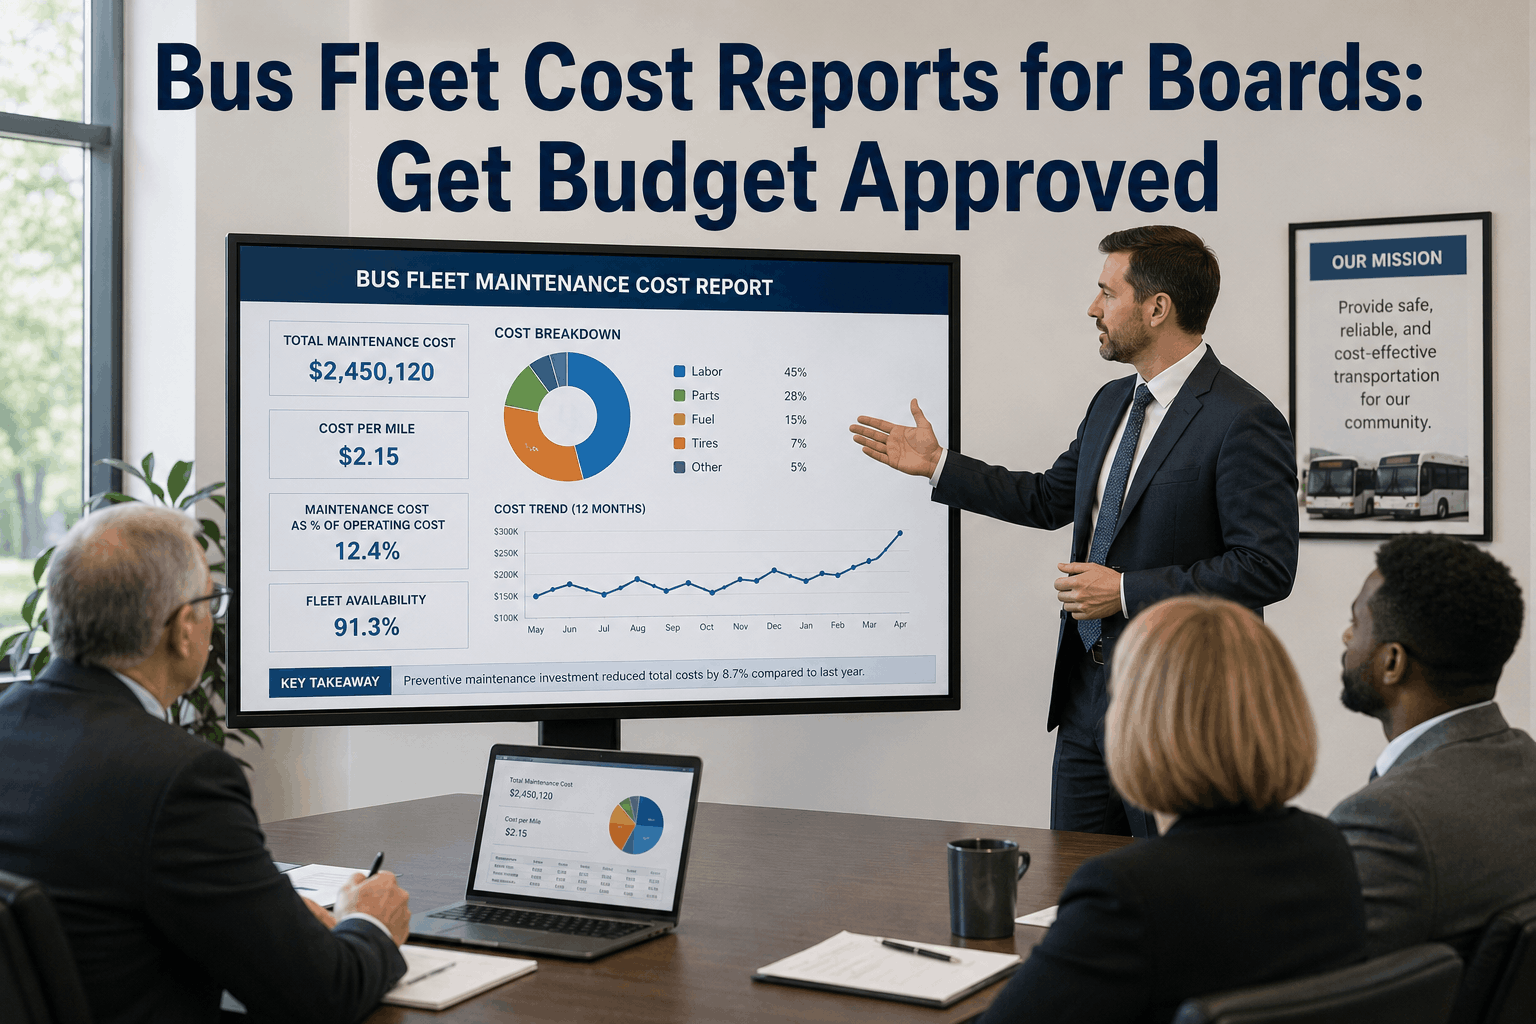
Bus Fleet Cost Reports for Boards: Get Budget Approved


Your maintenance budget was cut 15% last month. The board wants to know why you need more funding for a program that "just keeps buses running." You have six spreadsheets showing maintenance costs, fuel expenses, and repair frequency data — but presenting raw numbers to non-technical board members only confuses them and strengthens the case for budget cuts. Transit agencies that present cost data as a strategic narrative, not a data dump, get 40% more funding approval and protection against future cuts. Here's how to transform maintenance cost data into board-level reports that get your budget approved, prove ROI, and protect your program from year-over-year reductions.

2026 Leadership Strategy

Bus Fleet Cost Reports for Board Leadership: Transform Data Into Budget Approval

Cost-per-mile metrics. Preventive vs. reactive breakdown. Cost trends over 36 months. KPI dashboards. Executive summaries. The reporting framework that turns maintenance cost data into board-ready presentations that earn approval and protect your budget from cuts.

01 Why Board Members Don't Understand Maintenance Costs (And How to Fix It)

Board members are not maintenance experts. They're business leaders, community advocates, and fiduciary overseers — most with no exposure to fleet mechanics or preventive maintenance cycles. When you present them with itemized repair costs, parts inventory spreadsheets, and diesel consumption trends, their eyes glaze over. They default to one question: "Can we defer this spending and cut the budget?"

The problem isn't the data — it's the presentation. Board-level reporting requires translation. A $47,000 transmission rebuild isn't a line item. It's proof of deferred maintenance that could have cost $8,000 in preventive servicing three years ago. An $12,000 spike in unexpected downtime isn't a seasonal cost variation. It's evidence that buses without PM schedules fail more often and strand passengers. When you present cost data through that lens, the board stops seeing maintenance as an expense to minimize and starts seeing it as an investment that prevents crises.

02 The 5 KPIs Every Board Report Must Include

Don't overwhelm the board with 20 metrics. Five carefully chosen KPIs tell the complete story: fleet health, cost efficiency, risk management, and financial impact. These five metrics, tracked over 36 months, give board members the baseline they need to make informed funding decisions.

KPI #1
Cost Per Mile (Total Maintenance)
Total maintenance spend (labor + parts) divided by total fleet miles traveled. This is your efficiency baseline. A well-maintained 500-bus fleet costs $0.38–0.52 per mile. Higher indicates reactive maintenance dominance; lower suggests strong preventive programs. Track annually and compare to peer agencies.
Industry Baseline: $0.42/mile
KPI #2
Preventive vs. Reactive Maintenance Ratio
Percentage of maintenance work that is scheduled (preventive) versus unplanned (reactive/emergency). Best-practice fleets operate at 80% preventive, 20% reactive. Agencies heavily reliant on reactive repair spend 2.3x more per repair due to emergency labor rates and cascading component failures.
Target: 80% Preventive / 20% Reactive
KPI #3
Mean Time Between Failures (MTBF)
Average number of miles driven before an unplanned breakdown occurs. Higher MTBF indicates healthier fleet. A strong PM program increases MTBF from 18,000 miles to 45,000+ miles. This metric directly correlates to on-time performance, passenger satisfaction, and operational reliability.
Target: 40,000+ miles between failures
KPI #4
Budget Variance (Actual vs. Planned)
Percentage difference between budgeted maintenance costs and actual spending. Budget variance under 10% indicates strong cost control and predictability. Variance over 25% suggests reactive emergency spending dominates and cost forecasting is unreliable — a red flag for boards reviewing fund allocation.
Target: Variance under 10%
KPI #5
Cost Avoidance Through Preventive Maintenance
Quantified savings by implementing preventive schedules. If your agency avoided 8 major overhauls (average cost $35,000 each) through preventive maintenance, that's $280,000 in cost avoidance. This number is often hidden in spreadsheets but is the most compelling metric for board approval.
Calculate: (Breakdowns prevented × Avg repair cost)
03 The Board Report Structure: Executive Summary to Appendix

A board-ready cost report has seven distinct sections. Follow this structure and you'll keep board members engaged through data without losing them in minutiae.

Section 1
One-Page Executive Summary

Single page, three graphics, zero jargon. Include: this year's cost-per-mile, 3-year trend line showing improvement or decline, cost avoidance quantified in dollars, and one recommendation (e.g., "Invest in predictive maintenance to reduce reactive costs by estimated $340K annually"). Board members read this or nothing else — make it count.

Section 2
Fleet Health Snapshot (Current Month/Quarter)

How many buses are out of service for maintenance? Average time to repair? Percentage of planned work completed on schedule? This section shows current operational impact of cost decisions. If 12% of fleet is down for repairs due to deferred maintenance, that's a direct link between budget decisions and passenger impact.

Section 3
5 KPI Trend Analysis (36-Month View)

Three line graphs showing cost-per-mile, MTBF, and budget variance over 36 months. Label inflection points: "When we increased PM frequency in Q2 2023, MTBF improved 34%." These trends are the evidence that preventive spending works.

Section 4
Cost Breakdown: Categories & Trends

Pie or bar chart showing cost distribution: tires (18%), brakes (14%), engine/transmission (22%), fuel (28%), other (18%). Include year-over-year comparison. Highlight any category with unusual growth (e.g., "Brake costs up 24% due to extended PM interval reduction to prevent emergency callouts").

Section 5
Case Studies: Specific Cost Avoidance Examples

Three concrete examples: Bus #142 — PM caught cracked motor mount before it failed, saving $18,000 major repair. Bus #67 — regular brake inspections extended brake pad life from 45K to 72K miles, saving $3,200. Bus #224 — early transmission fluid analysis detected contamination, preventing $64,000 overhaul. Real buses, real money saved.

Section 6
Competitive Benchmarking (Peer Agencies)

Your cost-per-mile versus similar-sized transit agencies in your region. If you're at $0.44/mile and peer average is $0.58/mile, you're operating more efficiently. This validates your program and shows the board you're outperforming peers.

Section 7
Budget Justification & Funding Ask

Explicit recommendation tied to data: "Allocate $2.8M for preventive maintenance programs in FY2026. Historical data shows each $1 spent in preventive maintenance saves $2.80 in emergency repairs. Expected ROI: 180% annually." Connect the ask directly to evidence from sections 3–5.

⚠
The board report is not a technical document. Every page should have exactly one graphic or table. Every number should be contextualized (not just "$47,200 spent on repairs" but "$47,200 in unplanned repairs due to missed PM cycles — preventive maintenance would have cost $8,000"). Never use jargon without explanation. If a board member asks "What does MTBF mean?" you've lost them.
04 Turning Raw Maintenance Data Into Persuasive Graphics

The difference between a cost report the board ignores and one that drives approval is visual communication. Three specific graphics appear in nearly every board-approved maintenance report.

Graphic 1: The Cost-Per-Mile Trend Line

Simple line graph showing cost-per-mile over 36 months. If your agency implemented a new PM program 18 months ago, the line should show a dip at that point (preventive spending increases short-term, but total cost per mile decreases within 6 months due to fewer breakdowns). Label the inflection point: "PM program launched; immediate cost spike followed by 26% efficiency gain."

$0.60 $0.30 Months PM Launched
Graphic 2: Preventive vs. Reactive Pie Chart

Show your current ratio side-by-side with the industry best-practice benchmark (80/20). If you're at 60% preventive and 40% reactive, this visualization screams "opportunity for improvement." The board sees immediately that increasing preventive maintenance is the lever to pull.

60% Preventive Reactive 40% Current: 60% Preventive Target: 80% Preventive
Graphic 3: Cost Avoidance Waterfall

Waterfall chart showing: "Unplanned Maintenance Cost if We Went Fully Reactive: $2.8M" → "Preventive Program Cost: $780K" → "Net Savings Through Prevention: $2.02M." This single graphic is the most persuasive for budget approval. Board members see ROI in one glance.

Reactive Cost $2.8M Prevention $780K Net Savings $2.02M
05 How to Present Cost Data Without Losing the Board

Presentation technique is half the battle. A technically perfect report delivered poorly still gets cut. Here are the presentation tactics that increase board approval rates.

Tactic 1
Lead With Impact, Not Cost
Don't open with "Maintenance costs were $2.8M." Open with "Our preventive maintenance program kept 97% of buses on time this month — highest reliability in five years." Then connect to cost: "This reliability costs $780K annually but saves $2M in emergency repairs."
Tactic 2
Use Passenger Impact as the Bridge
Board members care about passengers and community more than maintenance mechanics. Say "Unplanned breakdowns strand 420 passengers per month on average" before discussing cost. Then: "Preventive maintenance reduced breakdowns by 54%, improving passenger trust and ridership."
Tactic 3
Quantify Risk in Deferred Maintenance
If the board cuts maintenance budget, explicitly state the risk: "A 10% cut to PM means we skip 120 preventive services annually. Historically, skipped services result in failures within 8 weeks. Projected cost: $340K in emergency repairs and 60 instances of passenger stranding."
Tactic 4
One visual per claim. If you make a statement ("Our cost-per-mile is 26% better than peer average"), immediately show a bar chart proving it. Board members believe what they see.
Tactic 5
End With a Single Clear Ask
Don't leave the budget question open. End with: "Based on this data, we request $2.8M for preventive maintenance, $340K for parts inventory, and $180K for technician training — total $3.32M. This maintains current fleet health and meets federal compliance. Any questions?" Specific, clear, justified.
We went from having our maintenance budget cut every year to getting a 12% increase because we stopped showing raw costs and started showing impact. When the board saw that preventive maintenance was preventing 18 breakdowns per month, they realized maintenance isn't a cost center — it's a reliability investment. Our board report went from 5 pages to 12 pages and the approval time cut from 4 weeks to 2 days.
— Transit Director, 85-bus agency, Texas
06 Common Report Mistakes That Get Maintenance Budget Cuts

These are the mistakes that cost maintenance budgets approval. Avoid them and your next report will be stronger.

Mistake 1: Presenting Expenses Without Context
Showing "$45,000 in parts costs" without explaining whether that's on-target, above budget, or represents efficient purchasing makes the board question whether money is being spent wisely. Always present actual vs. budget, and explain variance.
Mistake 2: Using Technical Jargon
Board members don't know what "extended drain intervals" or "condition-based PM scheduling" means. Translate: "We test oil quality regularly instead of changing it on a set schedule, which cuts oil costs by 18% annually."
Mistake 3: Hiding Cost Avoidance
If preventive maintenance avoids $2M in reactive repairs, that's your headline. Don't bury it in an appendix. Cost avoidance is the most persuasive metric for board approval.
Mistake 4: Comparing to Budget Instead of Industry
Only comparing your cost-per-mile to your own budget tells no story. Compare to peer agencies, national benchmarks, and your own 3-year trend. "We're 26% more efficient than peer average" is a powerful statement.
Mistake 5: Not Explaining Seasonal Variance
Maintenance costs vary seasonally (winter brake wear, summer cooling system failures). If you don't explain why Q1 costs spike, the board thinks you're overspending. Explain: "Winter months show 14% higher brake costs due to extended braking and road salt corrosion."
Mistake 6: Proposing Solutions Without Data
Saying "We need more technicians" without data is a budget cut waiting to happen. Say "Adding two technicians would reduce average repair time from 4.2 days to 2.8 days, saving 120 unplanned downtime hours annually. ROI: 18 months."
07 Building Your 12-Month Board Reporting Calendar

Board reporting isn't a once-a-year event. Strategic agencies build a 12-month reporting calendar that keeps cost data in front of the board continuously, preventing surprise budget cuts and building a narrative of success.

Q1: Baseline & Prior-Year Analysis

January–March: Publish a detailed cost analysis from the prior year. Show full 36-month trend, KPI benchmarking, and any major unexpected costs (why did brake spending spike?). This sets the narrative for the year: what worked, what didn't, what's changing.

Q2: Mid-Year Check-In & Spending Trajectory

April–June: Report current-year spending against budget. Are you on pace? Running under? If over, explain why before the board gets concerned. Show mid-year KPI snapshots: MTBF, preventive ratio, cost avoidance. This is where you flag any budget reductions needed.

Q3: Seasonal Trend Analysis & Summer Performance

July–September: Highlight summer performance (cooling system failures, tire wear in heat, AC maintenance). Show any seasonal cost patterns. Report on summer service increases (extra buses in service for peak routes) and their maintenance impact.

Q4: Year-End Results & Budget Justification for Next Year

October–December: Comprehensive year-end report. Full P&L for maintenance. Cost-per-mile final. Total cost avoidance quantified. Detailed budget proposal for the coming year with data justification for any increases. This is your main board hearing.

Your Next Board Hearing Doesn't Have to Be a Budget Defense.
Convert maintenance cost data into board-ready narratives. Five core KPIs. Executive summary. Trend analysis. Cost avoidance quantified. Peer benchmarking. Automated quarterly reporting. BusCMMS transforms raw CMMS data into reports that boards trust, understand, and fund.
08 Bus Fleet Cost Reporting FAQs
What is a realistic cost-per-mile for a school district bus fleet?
Industry average is $0.42–0.58 per mile depending on fleet age and maintenance practices. School districts with strong preventive programs operate at $0.38–0.45. Districts relying heavily on reactive repair average $0.65+. Your cost-per-mile is the single most important efficiency metric for board reporting.
How often should we update the board on maintenance costs?
Minimum quarterly (full KPI review), with executive summaries monthly if available. Most boards appreciate brief monthly trend updates (one page) and detailed quarterly analysis. An annual comprehensive report is the baseline for budget hearing.
Should we include fuel costs in our maintenance cost-per-mile metric?
No — fuel is typically separated as an operational cost distinct from maintenance. Maintenance cost-per-mile focuses on repairs, parts, labor, and preventive service. Fuel trends are reported separately as a consumption/efficiency metric.
How do we explain cost increases to the board without getting cut?
Frame increases through impact and outcome, not just cost. Instead of "Maintenance costs up 8%," say "Increased preventive service prevented 12 major breakdowns this year, which would have cost $420K in emergency repairs. Cost increase of $60K prevented $420K in failures — ROI 600%."
What data do we need from CMMS to build accurate cost reports?
Work order costs (labor + parts), vehicle miles driven, maintenance type classification (preventive vs. reactive), work order completion dates, and downtime hours. Most CMMS platforms can generate these reports automatically. Without them, board reporting is guesswork.
Can we use cost-per-mile to compare ourselves to other transit agencies?
Yes, with caveats. Compare only to fleets of similar size, age, and operating environment. A 500-bus urban transit agency differs from a 50-bus rural service. Peer comparison is powerful for boards, but use comparable agencies or national benchmarks published by APTA (American Public Transportation Association).
Should board members see detailed line-item costs or just the summaries?
Summary first, then details. Board executive session gets the executive summary with key visuals (3–5 pages). The full detailed report is available but not the primary presentation. If a board member asks detailed questions, you have the backup data ready.
How do we prove cost avoidance if the breakdowns never happened?
Use historical baseline. Calculate breakdowns that would have occurred if you operated at the same reactive maintenance rate as your prior years or peer average. Example: "Five years ago, we had 18 breakdowns per month. Today, with preventive maintenance, we average 3. At $1,200 average repair cost, that's $216K monthly savings ($2.6M annually)."
Turn Maintenance Data Into Board Approval
Five core KPIs. Three persuasive graphics. Executive summary. Trend analysis. Cost avoidance quantified. Peer benchmarking. Quarterly calendar. BusCMMS automatically generates board-ready cost reports from your CMMS data, every quarter, audit-ready.


Share This Story, Choose Your Platform!