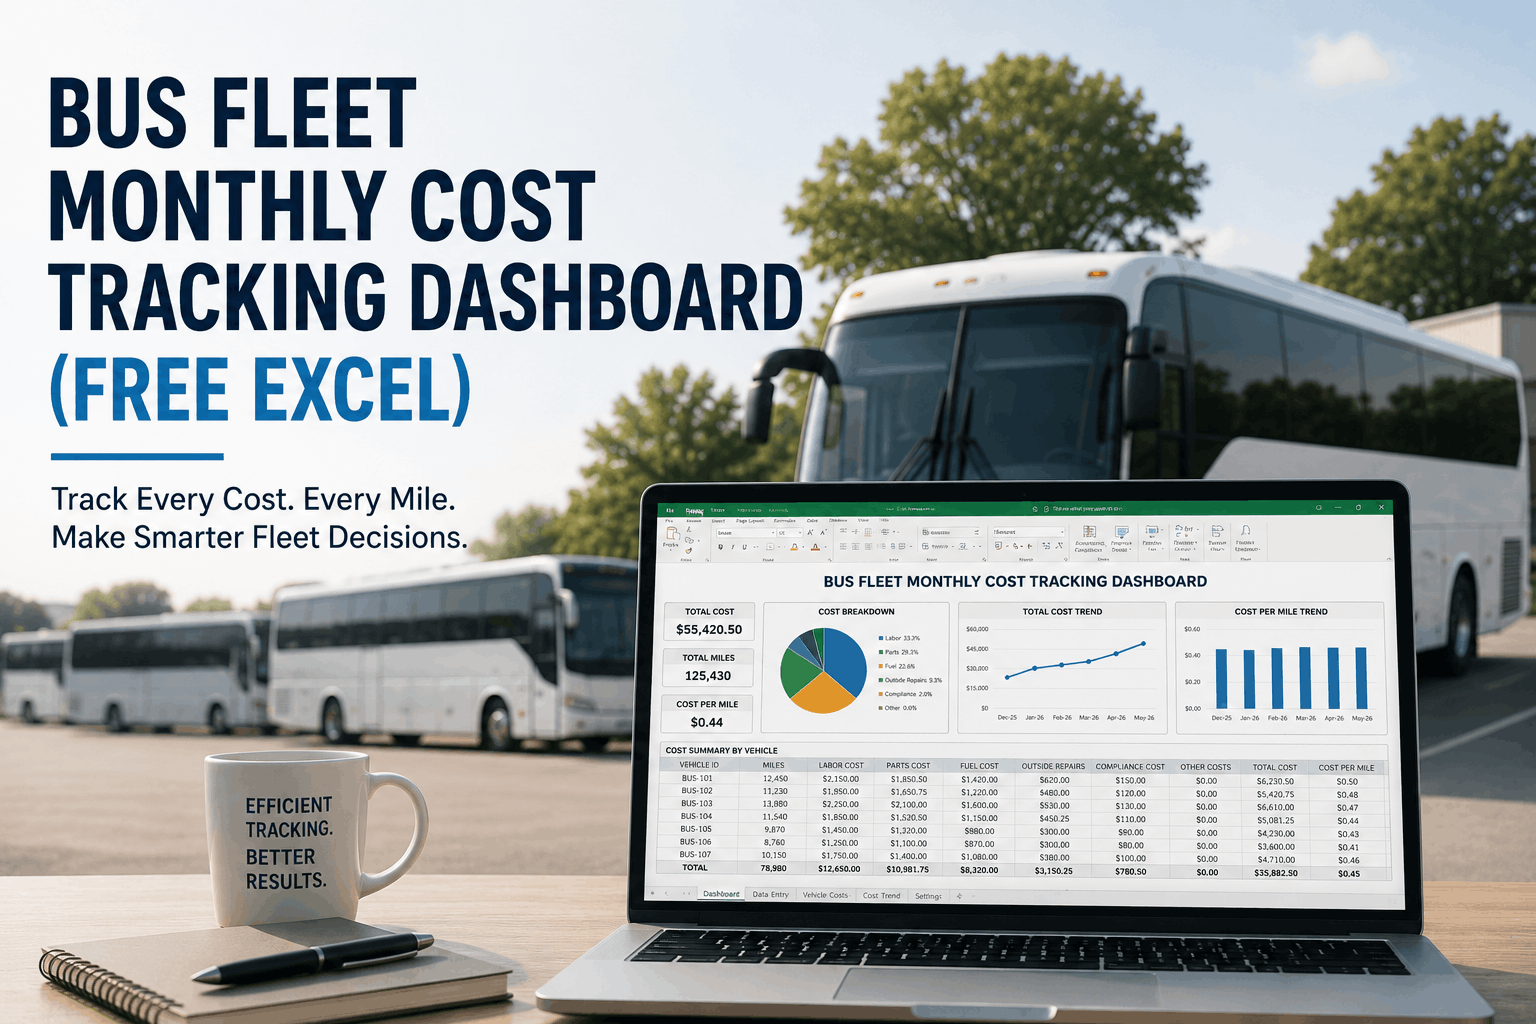
Managing bus fleet costs across labor, fuel, maintenance, parts, repairs, and compliance creates financial complexity that demands precision. Most transit operators struggle with fragmented spreadsheets, scattered invoices, and unclear cost-per-mile metrics that obscure profitability. Without real-time visibility into monthly expenses and variance tracking, fleet managers cannot identify spending anomalies, negotiate better vendor rates, or forecast accurate budgets. BusCMMS solves this with a comprehensive monthly cost tracking dashboard that consolidates every expense category, automatically calculates cost-per-mile, performs variance analysis against budgets, and provides actionable insights for cost reduction. Our free Excel template jumpstarts your cost management, while the full BusCMMS platform automates tracking across unlimited vehicles with advanced reporting, fuel efficiency analysis, predictive maintenance cost forecasting, and integration with accounting systems. Whether you operate school buses, transit fleets, shuttle services, or motorcoach operations, accurate cost tracking is foundational to sustainable profitability and competitive pricing. Start tracking today and reclaim thousands in hidden fleet expenses each month. Schedule a consultation to see how BusCMMS transforms your fleet economics.
Bus Fleet Monthly Cost Tracking Dashboard
Free Excel Template + Complete Cost Management Platform for School Bus, Transit, and Charter Operations
Complete Bus Fleet Cost Tracking Solution
Monthly Cost Dashboard
Consolidate labor costs, fuel expenses, parts inventory, outside repairs, compliance expenses, and vehicle-specific charges into a single unified dashboard. Auto-calculates rolling 12-month averages and monthly variance percentages to identify spending trends and anomalies.
Cost-Per-Mile Automation
Calculate true cost-per-mile across your entire fleet by dividing total monthly costs by miles driven. BusCMMS automatically imports odometer readings, trip logs, and fuel card data to compute accurate cost metrics for rate-setting and profitability analysis.
Labor Cost Tracking
Track driver wages, mechanic labor hours, administrative overhead, and fringe benefits by vehicle or route. Compare labor cost-per-mile across different operators and shifts to identify productivity improvements and scheduling optimization opportunities.
Fuel Cost Monitoring
Integrate fuel card data, GPS tracking, and engine diagnostics to monitor fuel consumption by vehicle, route, and driver. Identify excessive idling, inefficient routes, and poor fuel economy to reduce per-gallon costs and consumption waste.
Maintenance & Parts Ledger
Log preventive and reactive maintenance costs, parts inventory usage, labor hours, and outside vendor charges. Track maintenance cost trends to optimize parts purchasing, negotiate better supplier rates, and forecast capital replacement budgets.
Compliance Cost Tracking
Monitor DOT inspections, driver licensing, medical certifications, insurance premiums, safety audits, and regulatory filing costs. BusCMMS allocates compliance costs proportionally across vehicles to reveal true cost-per-mile for contract bidding accuracy.
Variance Analysis & Alerts
Automatic alerts when actual costs exceed budget by predefined thresholds. Drill down into variance by category, vehicle, driver, or time period to pinpoint the root cause of budget overruns and take corrective action immediately.
Budget Forecasting
Use historical cost data and predictive analytics to forecast next year's budget with confidence. BusCMMS learns seasonal patterns, inflation trends, and vehicle aging to provide realistic projections for fuel, maintenance, and compliance expenses.
Cost Tracking for School Bus, Transit, and Charter Fleets
Different fleet types face distinct cost challenges. BusCMMS cost tracking adapts to your specific operational model:
School Bus Fleets (Routing Authorities, Districts)
School districts need to allocate costs per route, per student, and per run. Our dashboard tracks per-pupil transportation costs, driver overtime, fuel surcharges, and state reimbursement reconciliation. Compare cost-per-mile across morning/afternoon/special runs to optimize scheduling and contractor payments.
Get School District TemplateTransit Authorities (Public & Private)
Transit operators track costs per route segment, per revenue hour, and per passenger-mile. BusCMMS integrates fare revenue data to calculate true operating cost-per-passenger and route profitability. Monitor subsidy requirements, identify underperforming routes, and benchmark against peer agencies.
Get Transit Authority TemplateCharter & Motorcoach Operations
Charter companies need accurate cost-per-hour and cost-per-mile to set competitive trip pricing while maintaining margins. Our dashboard tracks per-trip fuel, tolls, driver time, and vehicle depreciation. Generate cost proposals in seconds and improve bid-to-actual accuracy.
Get Charter Pricing TemplateShuttle & Paratransit Services
Shuttle operators serving universities, hotels, corporate campuses, and medical centers need flexible cost allocation across multiple contracts. BusCMMS tracks costs per contract, per hour, and per mile to ensure accurate billing and profitability across mixed-use vehicles.
Get Shuttle Service TemplateCost Categories in Our Bus Fleet Dashboard
Comprehensive cost tracking requires visibility into every expense that impacts fleet profitability:
Driver & Labor Costs
Salary, hourly wages, overtime, fringe benefits, payroll taxes, training time, uniforms, per diem
Fuel & Energy
Diesel, gasoline, CNG, electric charging, fuel surcharges, fuel tax, fuel card fees
Maintenance & Parts
Oil changes, filter replacements, tire rotations, brake service, engine overhauls, scheduled preventive maintenance labor
Outside Repairs & Warranty
Accident damage repairs, transmission rebuilds, dealer warranty work, roadside assistance calls, towing fees
Insurance & Compliance
Vehicle insurance premiums, liability coverage, FMCSA registration, DOT inspections, driver licensing, medical certifications, safety audits
Free Excel Cost Tracking Template vs. Full BusCMMS Platform
Download our free Excel template to get started today, or upgrade to BusCMMS for unlimited scalability, automation, and analytics:
| Capability | Free Excel Template | BusCMMS Platform |
|---|---|---|
| Cost Categories Tracked | 5 Categories | Unlimited Categories |
| Vehicles Supported | Up to 10 Vehicles | Unlimited Vehicles |
| Cost-Per-Mile Calculation | Manual Entry | Auto-Calculated from Fleet Data |
| Variance Analysis | Basic Formula | Advanced with Alerts & Drill-Down |
| Budget Forecasting | No | AI-Powered Predictions |
| Integration with Accounting | Manual Export | Automatic QuickBooks/Sage Sync |
| Mobile Access | No | Full Mobile Dashboard |
| Real-Time Data Updates | Manual Updates | Automatic GPS, Fuel Card, OBDII Integration |
| Multi-User Collaboration | Single User | Unlimited Users with Role-Based Access |
| Reporting & Analytics | 3 Pre-Set Reports | 50+ Custom Reports & Export Options |
| Cost | Free | $89-299/month (50-500 vehicles) |
How BusCMMS Cost Tracking Reduces Fleet Expenses by 35-50%
Real fleet operators report dramatic cost savings within 90 days of implementing comprehensive cost tracking:
$18K-24K
Fuel Efficiency Gains (20-30% reduction)
Identify excessive idling, poor route efficiency, and driver behavior patterns that waste fuel. BusCMMS integrates with fuel cards and telematics to flag inefficiencies in real-time, enabling targeted driver coaching and route optimization.
$12K-18K
Maintenance Cost Reduction (25-35% savings)
Shift from reactive to predictive maintenance by tracking actual maintenance patterns and cost trends. Identify parts that fail prematurely, renegotiate vendor contracts, and optimize preventive maintenance intervals for maximum component life.
$8K-14K
Insurance Premium Negotiation (15-25% reduction)
Document improved safety metrics, lower accident rates, and better driver compliance to negotiate better insurance rates. Present data-driven evidence of cost control to insurance brokers and carriers.
$6K-10K
Labor Efficiency & Overtime Reduction (12-18% savings)
Identify overtime patterns, excessive wait time, and inefficient scheduling. Optimize shift assignments and route planning to reduce labor hours while maintaining service levels and driver satisfaction.
$4K-8K
Vendor Management & Parts Procurement (10-20% savings)
Analyze spending by vendor and parts category. Use competitive bidding insights and volume purchase data to negotiate better pricing with suppliers and reduce parts inventory carrying costs.
Cost Tracking Success Metrics & KPIs
Monitor these cost-related KPIs through BusCMMS to ensure profitability and operational efficiency:
Cost Per Mile
Total monthly fleet cost ÷ total miles driven. Target: Track reduction month-over-month. Industry benchmark: $1.50-$2.80 depending on fleet type.
Cost Per Hour
Total monthly cost ÷ operational hours. Essential for charter and transit pricing. Track by route, vehicle, and driver.
Fuel Cost Per Mile
Fuel cost ÷ miles driven. Target: 5-7 miles-per-gallon equivalent. Improving this metric directly impacts profitability.
Maintenance Cost Per Mile
Maintenance & parts cost ÷ miles driven. Track by vehicle age and mileage to predict major overhaul needs.
Labor Cost Per Mile
Total labor cost ÷ miles driven. Benchmark across drivers to identify training needs and efficiency opportunities.
Budget Variance %
(Actual cost - budgeted cost) ÷ budgeted cost × 100. Target: Keep variance within ±5% monthly.
Cost of Goods Sold (COGS)
Total operating costs as percentage of revenue. Lower COGS improves net margin. Target: 65-75% depending on service type.
Vehicle Utilization Cost
Total cost ÷ percentage of time vehicle is in revenue service. Identifies underutilized vehicles and helps right-size fleet.
How to Implement Bus Fleet Cost Tracking in 5 Steps
Get your cost tracking system operational within 30 days:
1
Audit Current Costs & Data Sources
Collect 12 months of historical cost data: invoices, fuel card statements, payroll records, insurance documents, maintenance logs, and vehicle registrations. Identify data sources you can automate (fuel cards, telematics, payroll systems).
2
Download Free Template or Setup BusCMMS
Start with our free Excel template to establish cost categories and baseline metrics. When ready to scale, migrate data into BusCMMS with our import tools and onboarding team support.
3
Establish Cost Categories & Chart of Accounts
Define how you'll categorize costs: by vehicle, by cost type, by department, by route, or by profit center. Map cost codes to your accounting system for seamless integration and reconciliation.
4
Integrate Automated Data Sources
Connect fuel cards, GPS/telematics, OBDII sensors, payroll systems, and accounting software for automatic daily updates. Less manual data entry means fewer errors and real-time visibility.
5
Set Budgets, Alerts & Monthly Reviews
Establish monthly cost budgets and variance thresholds. Review dashboards weekly and conduct monthly cost analysis meetings. Use insights to optimize procurement, driver behavior, maintenance schedules, and pricing strategies.
Real Bus Fleet Cost Tracking Results
See how operators like you reduced costs and improved profitability:
School District: 85-Bus Fleet
Challenge: Manual spreadsheets, unclear cost-per-student-mile, unable to justify transportation budget requests to school board
Solution: Implemented BusCMMS cost tracking with automated fuel and maintenance integration, created cost-per-student-mile dashboards
Results: $145,000 annual savings through fuel optimization and maintenance cost reduction; provided board-ready cost justification reports; improved transparency with transportation supervisors
Charter Company: 32-Coach Fleet
Challenge: Unprofitable trips because cost-per-hour calculations were inaccurate; unable to price competitively while maintaining margins
Solution: Deployed cost tracking with real-time fuel, driver time, and toll integration; created proposal templates with accurate cost-per-hour pricing
Results: 23% margin improvement on new contracts; reduced bid-to-actual variance from 18% to 3%; bid frequency increased 40% due to faster proposal turnaround
Transit Authority: 180-Bus Urban Fleet
Challenge: Subsidy costs rising faster than revenue; unable to identify cost reduction opportunities across large diverse fleet
Solution: Implemented BusCMMS cost tracking by route segment and revenue hour; created variance alerts for abnormal maintenance or fuel costs
Results: Identified $310,000 in annual fuel waste through idle and route inefficiency analysis; renegotiated vendor contracts saving 18%; improved cost predictability for budget forecasting
Cost Tracking FAQ: Your Fleet Questions Answered
Get answers to common questions about implementing cost tracking in your bus fleet:
How do I calculate accurate cost-per-mile for bid pricing?
Divide total monthly fleet operating costs (labor, fuel, maintenance, insurance, compliance) by total miles driven that month. BusCMMS automates this calculation daily from telematics and accounting data. For bid pricing, use a weighted average across similar vehicles and routes to ensure margin consistency.
What's the difference between cost-per-mile and cost-per-hour?
Cost-per-mile divides total cost by distance driven and is ideal for route-based fleets. Cost-per-hour divides total cost by operational hours and suits charter, shuttle, and tour operations. Track both to understand cost drivers on routes with varying speed profiles, stop frequencies, and traffic conditions.
How often should I review cost dashboards?
Review high-level KPIs weekly and conduct detailed cost analysis monthly. Weekly reviews help catch anomalies (fuel spikes, unexpected repairs); monthly analysis identifies trends and enables budget adjustments. BusCMMS alerts notify you immediately of budget variances exceeding thresholds.
Can I integrate fuel cards, telematics, and payroll data automatically?
Yes. BusCMMS integrates with WEX, Fuel Tech, Verizon Connect, Samsara, Geotab, and major payroll platforms. Automatic integration eliminates manual data entry, reduces errors, and provides real-time cost visibility. Setup takes 2-4 hours with our support team.
How do I account for seasonal cost variations?
BusCMMS tracks seasonal patterns across 24+ months of historical data. School fleets see higher fuel costs in winter and maintenance spikes in spring. Set seasonal budgets reflecting these patterns and use our forecasting tools to predict next year's costs with 94% accuracy.
What should I benchmark my cost-per-mile against?
School bus fleets typically run $1.60-$2.20 per mile; transit authorities $2.10-$3.50 depending on service density; charter operators $2.30-$3.80. BusCMMS benchmarks your metrics against peer operators in your region and fleet size category for competitive context.
How accurate are BusCMMS cost forecasts?
Our AI forecasting achieves 92-96% accuracy for 12-month predictions using historical cost patterns, seasonal trends, vehicle aging curves, and fuel price projections. Accuracy improves as you add more historical data (minimum 6 months; optimal 24 months).
Can multiple managers access cost data simultaneously?
Yes. BusCMMS supports unlimited multi-user access with granular role-based permissions. Finance teams see all costs; operations managers see vehicle-specific costs; mechanics see maintenance costs only. USA-based customers receive 24/7 support for access and permissions management.
What Our Bus Fleet Customers Say About Cost Tracking
"We were losing money on half our routes and didn't know it. BusCMMS cost tracking showed us exactly where fuel and maintenance were killing our margins. We adjusted pricing and saved $180,000 in year one. This software paid for itself in the first month."
— David Martinez, Owner, Southwest Charter Services (32 Coaches), Phoenix, Arizona