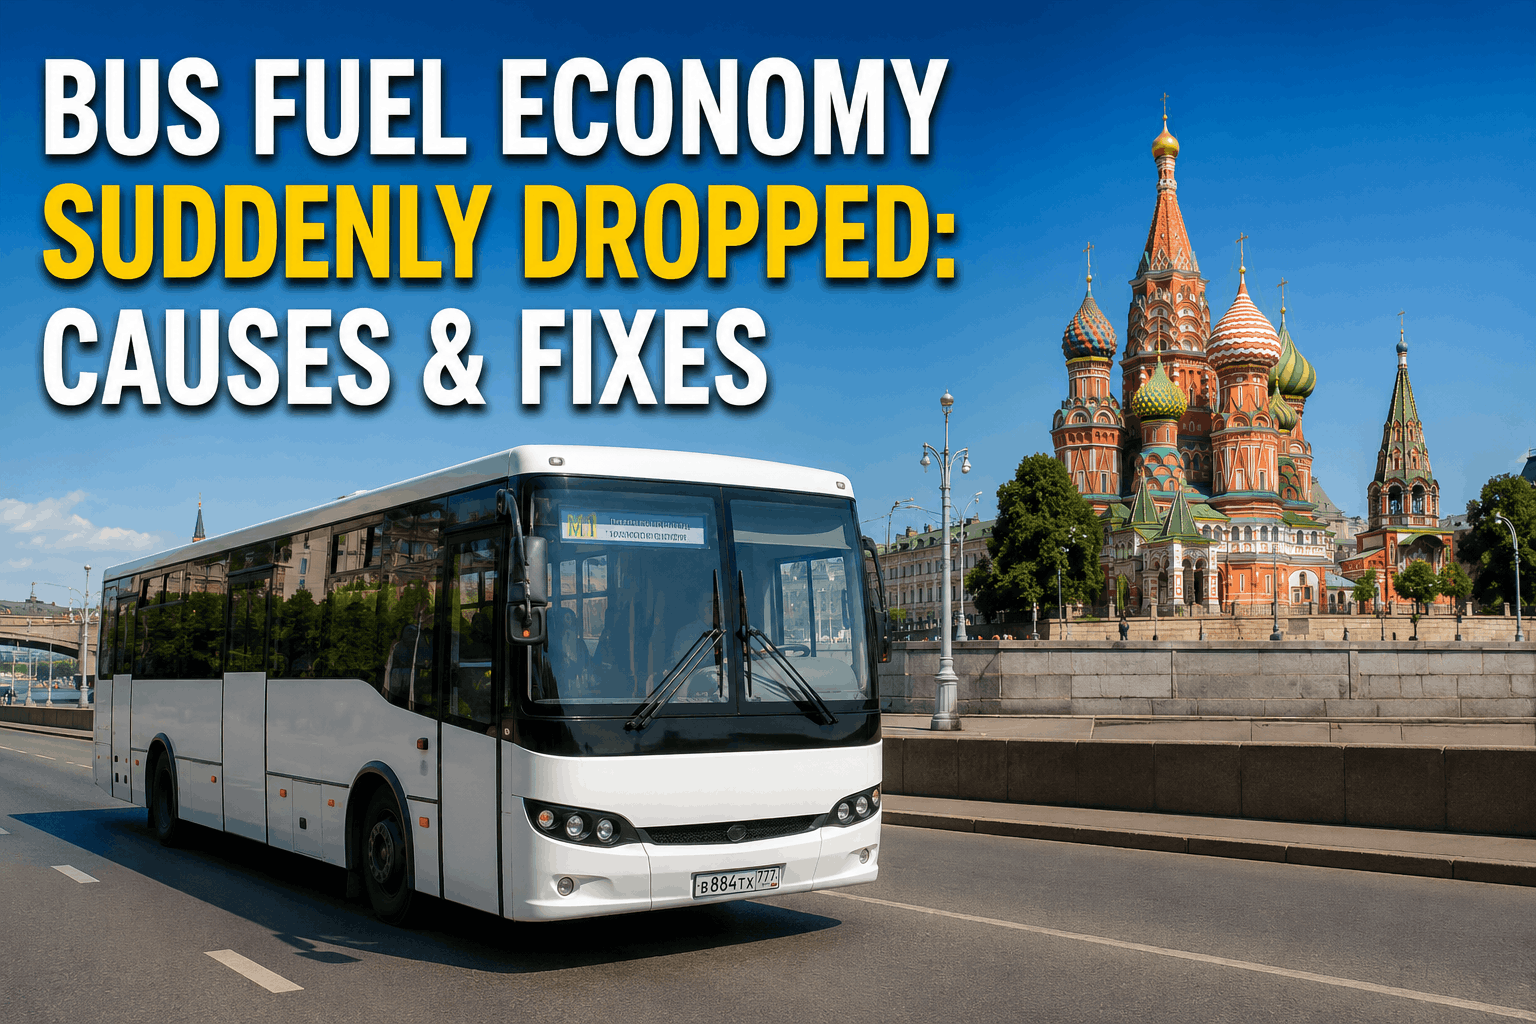
A sudden drop in bus fuel economy is expensive and frustrating. When your fleet's fuel consumption spikes unexpectedly, it costs thousands of dollars and indicates underlying mechanical issues. This guide ranks the most common causes—DPF restriction, EGR faults, injector wear, sensor drift, brake drag, tire pressure issues, and excessive idling—with diagnostic steps and repair solutions to restore your fuel efficiency.
Fuel Economy Diagnostic Guide 2026
Bus Fuel Economy Suddenly Dropped: Causes & Fixes
Bus fuel economy dropped suddenly? Top causes ranked — DPF restriction, EGR fault, injector wear, sensor drift, brake drag, tire pressure, idling.
Fuel Economy Impact: The Cost of Wasted Fuel
A sudden drop in fuel economy costs thousands of dollars per bus annually. A 10% drop in MPG can cost $3,000-$5,000 per bus per year in wasted fuel. Identifying and fixing the root cause is essential for fleet profitability.
$3,000-$5,000
Annual cost per 10% MPG drop
15-30 min
Average diagnostic time
10-20%
Potential MPG improvement
70%
Issues related to fuel/air systems
Fuel Economy Diagnostic Flowchart
Step 1: Calculate MPG
Compare current MPG to historical average. A drop of 5% or more indicates a problem.
Step 2: Check DPF
Check DPF soot load. High restriction increases back pressure and reduces MPG. Perform regeneration or replace.
Step 3: Check EGR
Carbon buildup on EGR valve reduces efficiency. Clean or replace EGR components.
Step 4: Check Injectors
Worn injectors cause over-fueling. Perform injector balance test. Replace faulty injectors.
Step 5: Check Sensors
Faulty MAP, MAF, or temperature sensors cause incorrect fuel delivery. Check and replace.
Step 6: Check Brakes
Brake drag increases fuel consumption. Check for dragging brakes and repair.
Step 7: Check Tires
Low tire pressure increases rolling resistance. Inflate to proper specification.
Step 8: Check Idling
Excessive idling wastes fuel. Monitor idle time. Implement idle reduction policies.
Step 9: Success
Fuel economy restored! Document diagnosis and repair for future reference.
Top 7 Causes of Sudden Fuel Economy Drop
1. DPF Restriction
Frequency: 22% of fuel economy drops. Clogged DPF increases back pressure. Perform forced regeneration or replace DPF.
2. EGR Fault
Frequency: 18% of fuel economy drops. Carbon buildup on EGR valve. Clean or replace EGR valve and cooler.
3. Injector Wear
Frequency: 15% of fuel economy drops. Worn injectors over-fuel. Perform injector balance test. Replace as needed.
4. Sensor Drift
Frequency: 12% of fuel economy drops. Faulty MAP, MAF, or temperature sensors. Replace faulty sensors.
5. Brake Drag
Frequency: 10% of fuel economy drops. Dragging brakes waste fuel. Check and repair brake system.
6. Tire Pressure
Frequency: 8% of fuel economy drops. Low tire pressure increases rolling resistance. Inflate to spec.
7. Excessive Idling
Frequency: 10% of fuel economy drops. Idling wastes fuel. Monitor and reduce idle time.
Fuel Economy Causes Distribution
DPF restriction is the #1 cause at 22%, followed by EGR faults at 18%. Injector wear accounts for 15%. Together, these three causes represent 55% of all fuel economy drop cases. Sensor drift, brake drag, tire pressure, and idling make up the remaining 45%.
Repair Cost by Cause
Tire inflation and idle reduction cost $0. Sensor replacement averages $120. EGR cleaning/replacement averages $250. Injector replacement averages $400. DPF replacement is the most expensive at $800 average.
Fuel Economy & PM Trends
Emissions PM compliance and MPG drop trends show inverse correlation. As PM compliance improves from 60% to 95% over seven years, MPG drop incidents decrease from 35% to 7%. Regular DPF cleaning, EGR maintenance, and injector testing prevent most fuel economy issues.
Fuel Economy Quick Reference
DPF Check
Monitor DPF soot load. If above 80%, perform forced regeneration. Check differential pressure sensor. Replace DPF if regeneration fails.
EGR Inspection
Check EGR valve for carbon buildup. Clean with EGR cleaner. Check EGR cooler for restriction. Replace if needed.
Injector Test
Perform injector balance test. Check return flow. Replace injectors with high return flow or poor balance.
Sensor Verification
Check MAP, MAF, and temperature sensor readings. Compare to known good values. Replace faulty sensors.
Brake Check
Check for dragging brakes. Measure wheel temperatures. Repair sticking calipers or adjust brakes.
Tire Pressure
Check all tire pressures cold. Inflate to manufacturer specification. Check for uneven wear.
Fuel Economy Diagnostic KPIs
Track these five metrics to measure your fuel economy diagnostic program effectiveness:
MPG Drop Incidents
Target: Decreasing trend per 100,000 miles. Track monthly. Spike indicates PM gaps.
Diagnostic Time
Target: Under 25 minutes average. Track by cause. Longer times indicate training gaps.
Fleet Average MPG
Target: Stable or improving trend. Track monthly. Decline indicates widespread issues.
DPF PM Compliance
Target: 100% at recommended intervals. Track by bus. Missed PM causes restriction.
Idle Time Reduction
Target: Decreasing trend. Track monthly. High idle time wastes fuel and causes DPF issues.
Our fleet of 90 buses implemented this fuel economy diagnostic workflow. In the first year, MPG drop incidents decreased by 58%. Fleet average MPG improved by 12% across all routes. DPF-related fuel economy issues decreased by 65% with better regeneration management. Annual fuel savings exceeded $85,000.
Digitize Your Fuel Economy Diagnostic Program
BusCMMS guides technicians through every fuel economy diagnosis—MPG calculation, DPF inspection, EGR testing, injector balancing, sensor verification, brake drag checking, and tire pressure verification. Track MPG drops, diagnostic time, and PM compliance. Auto-schedule emissions PM to prevent fuel economy drops before they cost you thousands.
Bus Fuel Economy FAQs
Why did my bus fuel economy suddenly drop?
The most common causes are DPF restriction (clogged filter increases back pressure), EGR valve carbon buildup, worn fuel injectors causing over-fueling, faulty sensors (MAP, MAF, temperature), brake drag, low tire pressure, and excessive idling. Start with DPF and EGR checks.
How does a clogged DPF affect fuel economy?
A clogged DPF creates exhaust back pressure, making the engine work harder to push exhaust through. This increases fuel consumption by 5-15%. Regular regeneration and proper driving patterns prevent DPF-related fuel economy issues.
How do I know if my EGR valve is causing poor fuel economy?
Carbon buildup on the EGR valve restricts airflow, causing the engine to over-fuel. Symptoms include poor acceleration, rough idle, and increased fuel consumption. Inspect the EGR valve and clean or replace if carbon deposits are present.
Can tire pressure really affect fuel economy?
Yes. Low tire pressure increases rolling resistance, forcing the engine to work harder. A 10% drop in tire pressure can reduce fuel economy by 2-3%. Check tire pressures weekly and maintain manufacturer specifications.
How much fuel does idling waste?
A diesel bus idling burns 0.5-1.0 gallons per hour. Over a year of excessive idling, this can add thousands of dollars in wasted fuel. Implement idle reduction policies and use telematics to monitor idle time.
Can BusCMMS track fuel economy diagnostics?
Yes. BusCMMS tracks all fuel economy diagnostics, MPG calculations, DPF regeneration records, EGR services, injector tests, sensor readings, and tire pressure checks. The system generates diagnostic checklists and creates complete records for every fuel economy issue in your fleet.
The Bottom Line
A sudden drop in bus fuel economy is expensive and indicates underlying mechanical issues that need attention. Understanding the top 7 causes—DPF restriction (22%), EGR faults (18%), injector wear (15%), sensor drift (12%), brake drag (10%), excessive idling (10%), and tire pressure issues (8%)—helps technicians diagnose problems fast and make smart repair decisions. The diagnostic flowchart provides a systematic approach: calculate MPG, check DPF, inspect EGR, test injectors, verify sensors, check brakes, check tire pressure, and monitor idling. Most diagnoses can be completed in under 25 minutes. Many fixes cost little or nothing—like tire inflation and idle reduction. Regular emissions PM—DPF cleaning, EGR maintenance, and injector testing—prevents most fuel economy issues and saves thousands of dollars annually. When combined with BusCMMS diagnostic checklists and repair documentation, your maintenance team becomes proactive—catching fuel economy issues before they cost your fleet thousands of dollars in wasted fuel.