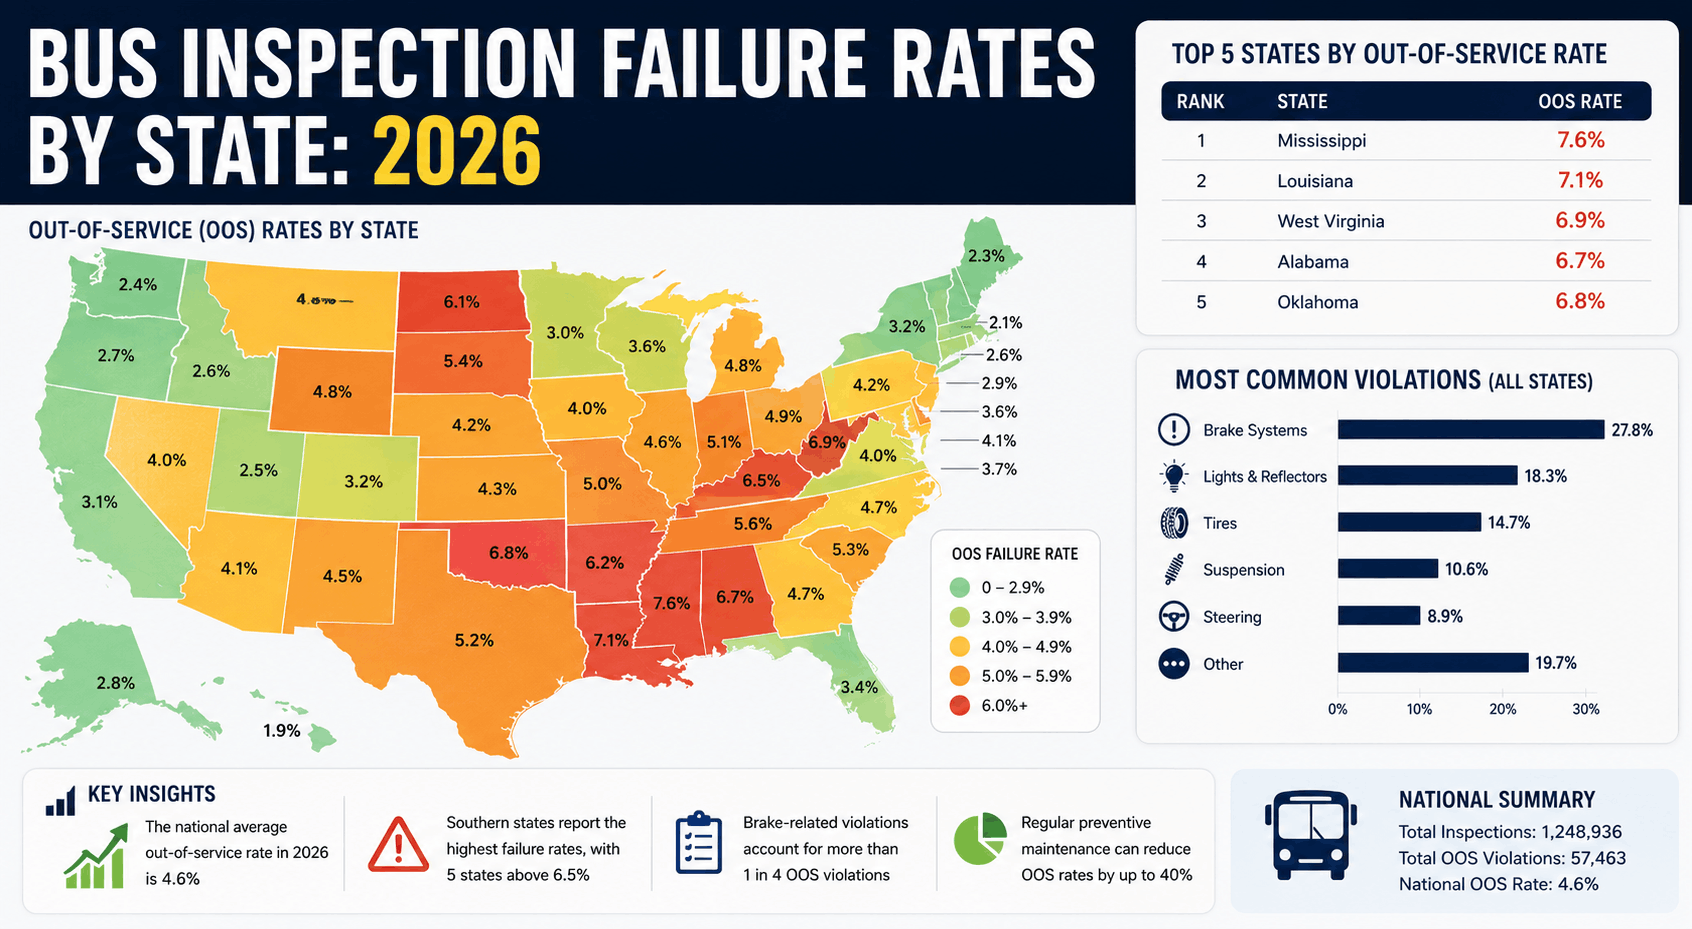
Your fleet just underwent a roadside DOT inspection. One bus received an out-of-service order for brake defects. Another passed with no violations. But how does your fleet compare nationally? Are your failure rates typical, or significantly worse? Nationally, 21.5% of commercial buses inspected at roadside receive out-of-service (OOS) orders — that's more than 1 in 5 buses failing critical safety standards. But failure rates vary dramatically by state. California and New York, with aggressive inspection programs, have OOS rates of 24–28%. Texas and Florida, with lighter enforcement, see 15–18% OOS rates. Understanding your state's baseline helps you benchmark fleet performance and set realistic compliance goals. This guide provides 2026 data on state-by-state inspection failure rates, the violations most commonly triggering OOS orders (brakes, tires, lighting), and how top-performing fleets (95%+ first-time pass rate) distinguish themselves from average operators.
State-by-state DOT inspection data. Learn which violations cause most failures. Benchmark your fleet against industry standards. Achieve 95%+ first-time pass rates.
Only 7% of motor carriers pass DOT audits without a single violation. Based on 2024–2025 CVSA (Commercial Vehicle Safety Alliance) inspection data, 21.5% of buses inspected receive out-of-service orders. One OOS violation costs $4,200+ on average (repair, towing, route disruption). Operating a bus under OOS order costs $23,048 in federal penalties alone, not counting additional liability exposure.
These ten violations account for nearly 95% of OOS orders. Focus compliance efforts here first.







