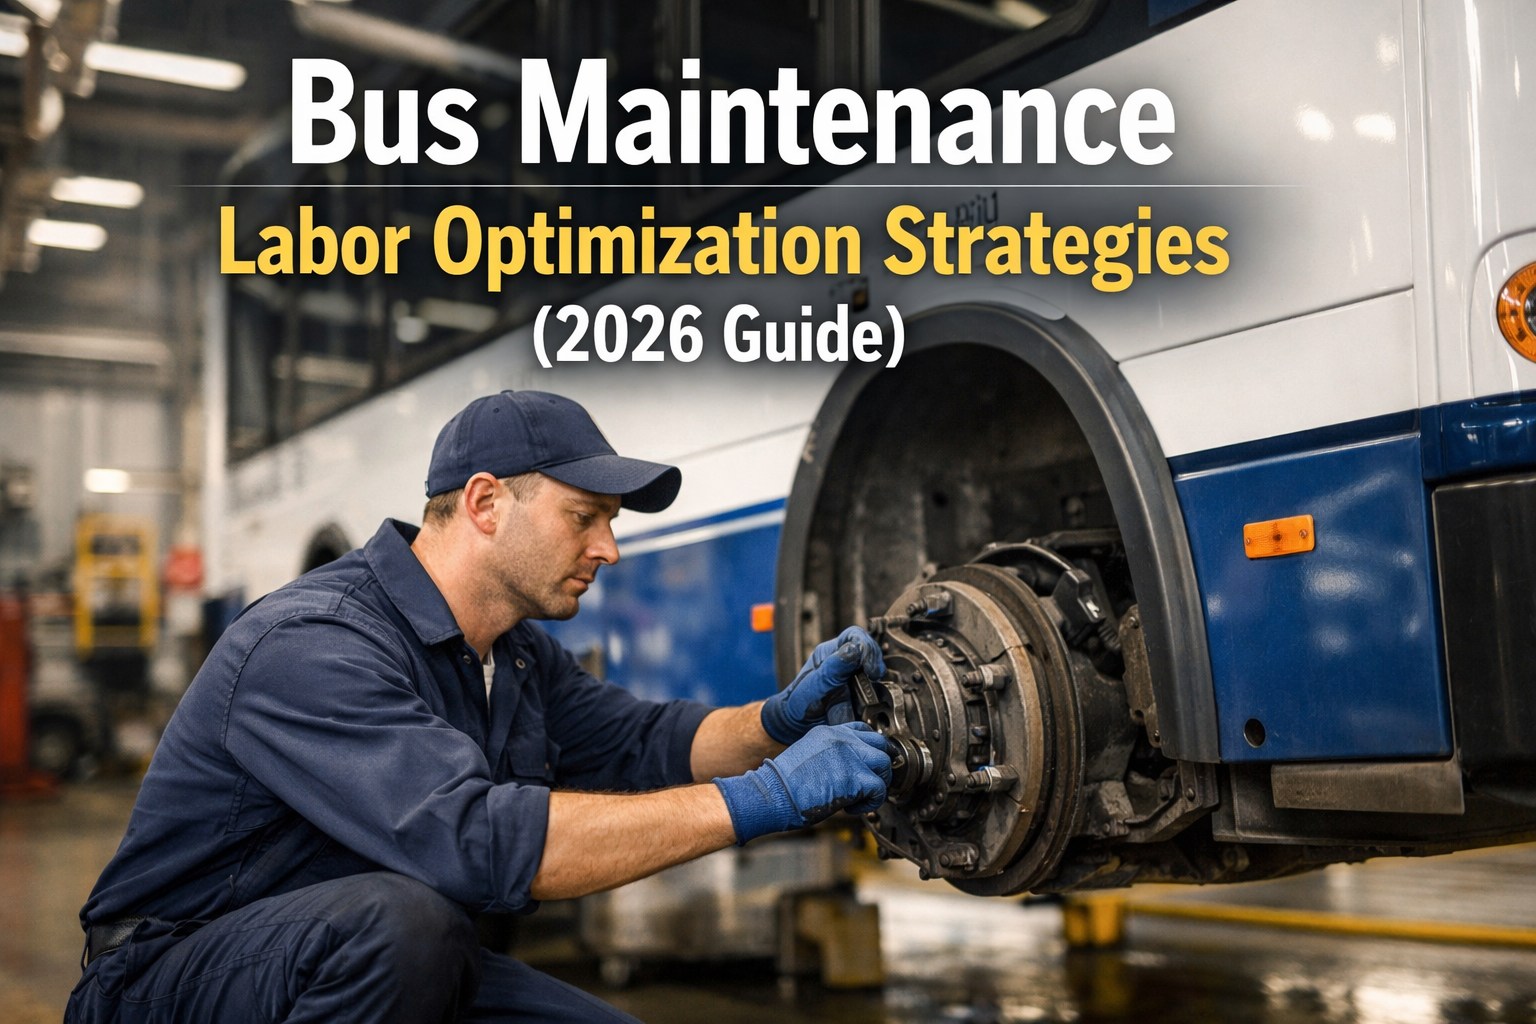
A 100-bus fleet with 15 technicians at $95/hour generates $2.85 million in annual labor expense. At 60% utilization, only $1.71 million translates to actual repair work. The gap represents recoverable value through systematic optimization. See how CMMS tracks labor metrics in a quick demo.
Direct Costs
- Base Wages: $28-45/hour for certified technicians
- Overtime: 1.5x-2x for after-hours work
- Benefits: 35-45% added to base wages
- Certifications: Premium for ASE, HV, OEM certs
Hidden Costs (Utilization Killers)
- Parts Waiting: 18% of shift time
- Info Search: 12% looking up specs/history
- Bay Waiting: 8% no workspace available
- Admin Tasks: 7% paperwork/timesheets
Technician Utilization Optimization
Manual Operations
55-65%
Average Utilization
CMMS-Optimized
78-85%
Average Utilization
Improving utilization from 60% to 80% on a 15-technician team recovers $570,000 annuallywithout adding headcount or increasing overtime. Start tracking utilization free with BusCMMS.
Skill-Based Work Order Assignment
Matching technician skills to job requirements reduces repair time by 25-40% and comeback rates by 60%. Book a demo to see skill-based assignment in action.
| Job Type | Skill Level | Assignment |
|---|---|---|
| Routine PM (A/B Service) | Level 1-2 | Junior techs, apprentices |
| Brake/HVAC Repair | Level 2-3 | Certified specialists |
| Engine/Transmission | Level 4 | Senior technicians |
| EV Battery/HV Systems | Level 4 + HV Cert | HV-qualified only |
Shift Planning & Overtime Reduction
Day Shift (6AM-2:30PM)
Scheduled PMs, parts ordering, training — 40-50% staff
Swing Shift (2PM-10:30PM)
Return repairs, road calls, quick-turn work — 35-40% staff
Night Shift (10PM-6:30AM)
Heavy repairs, overhauls when buses available — 15-25% staff
Overtime Reduction Tactics
✓ Predictive PM scheduling (avoid month-end crunches)
✓ Parts pre-staging before shift end
✓ Cross-shift handoff documentation
✓ Real-time workload visibility dashboards
See Labor Analytics in Action
BusCMMS tracks wrench time, utilization, and productivity metrics automatically.
Productivity Metrics & Benchmarks
| Metric | Poor | Average | Best-in-Class |
|---|---|---|---|
| Technician Utilization | <55% | 55-65% | 75-85% |
| Wrench Time | <50% | 50-60% | 70-80% |
| PM Compliance | <80% | 80-90% | 95-100% |
| Overtime Ratio | >15% | 10-15% | <5% |
| Comeback Rate | >10% | 5-10% | <3% |
CMMS Workforce Automation
Intelligent Routing
Auto-assign jobs based on skills, certs, and current workload
Capacity Planning
Live dashboards: available hours vs. pending work
Parts Verification
Jobs only assigned when parts are staged and ready
Performance Analytics
Individual + team metrics with trend analysis
ROI: 100-Bus Fleet Example
Utilization Improvement (15%)
$445,000
Overtime Reduction (45%)
$126,000
Rework Elimination
$148,000
Admin Time Savings
$84,000
Annual Labor Savings
$803,000
Frequently Asked Questions
What is a good technician utilization rate?
Industry average is 55-65%. CMMS-optimized fleets achieve 75-85%. Target 70-75% for sustainable productivity without burnout.
How do we measure wrench time?
Track actual hours on work orders vs. total clock-in hours. CMMS captures this automatically. Most fleets discover 30-40% is non-productive time.
What causes high overtime?
Uneven PM scheduling, parts delays, poor shift coverage, and weak cross-shift handoffs. CMMS planning addresses each root cause.
How quickly does CMMS reduce labor costs?
Measurable improvement in 60-90 days. Typical first-year: 15-25% utilization gain, 40-50% overtime reduction, 20-35% total labor cost reduction.
Labor costs rise 4-6% annually. Every month of delay increases your optimization gap.
Start Optimizing Maintenance Labor Today
BusCMMS delivers workforce automation, productivity tracking, and labor analytics for bus fleet operations.