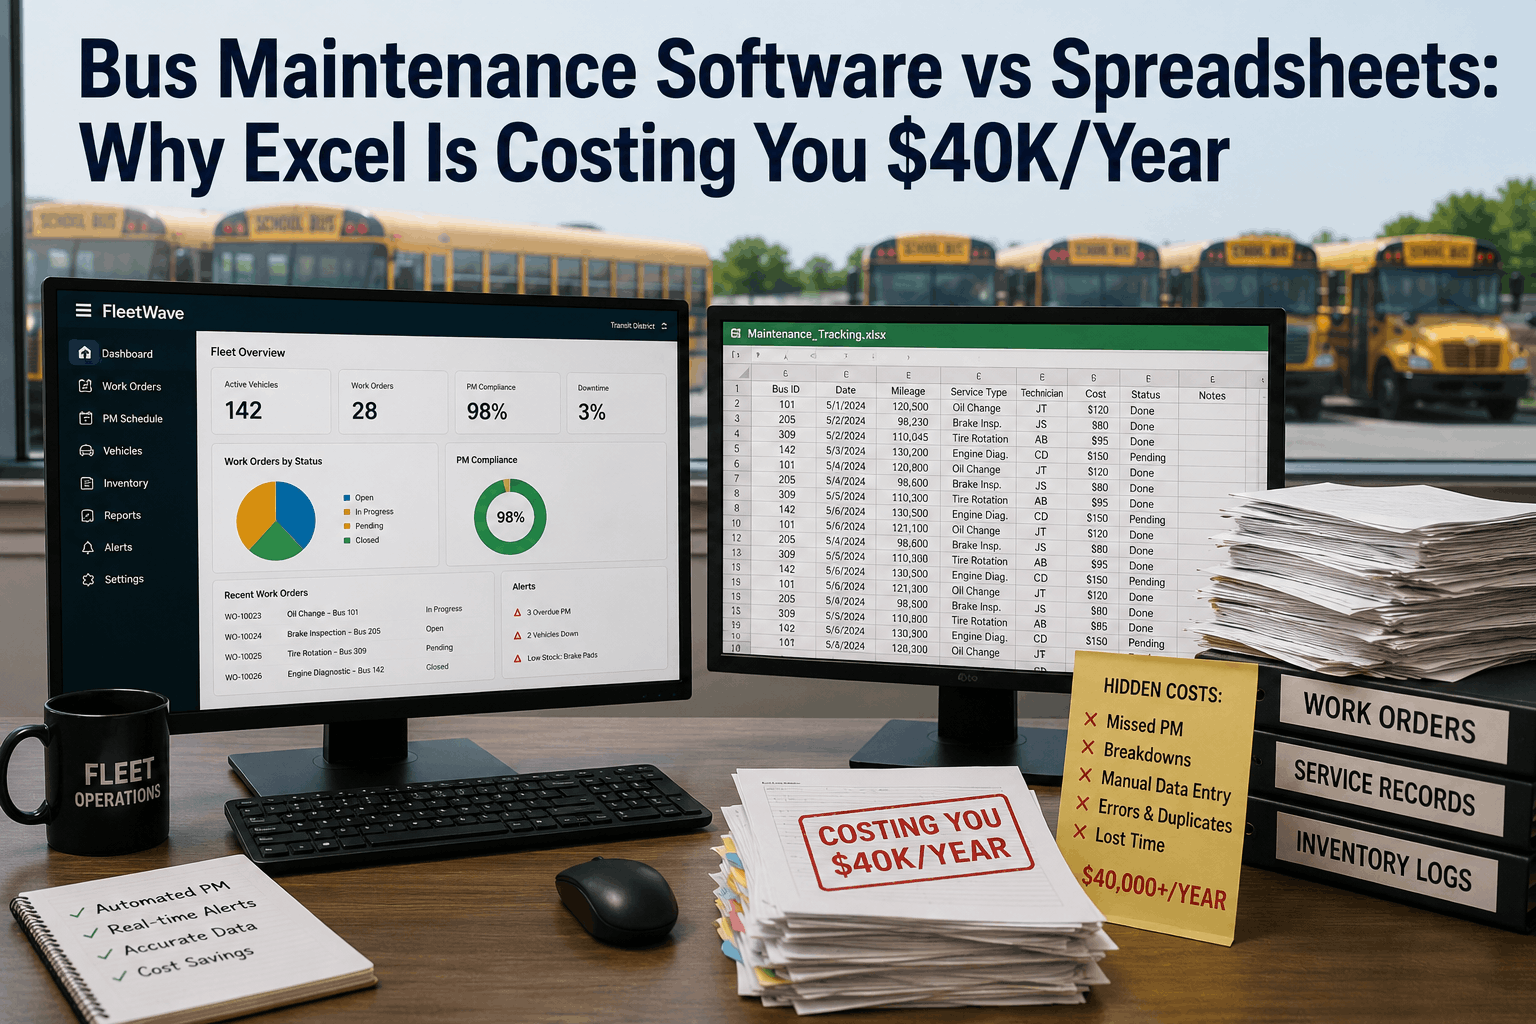
Many bus fleet operators still manage maintenance using spreadsheets. Excel is cheap, familiar, and doesn't require IT support. What could be wrong with that? Quite a bit, actually. Operating a bus fleet with spreadsheet-based maintenance management is incredibly expensive—far more expensive than purchasing a CMMS (Computerized Maintenance Management System) designed specifically for fleet maintenance. Research from 200 bus fleets across school districts, transit agencies, and commercial operators shows that spreadsheet-based management costs an average of $40,000 annually per 100-bus fleet in preventable expenses: emergency parts procurement at premium pricing, missed preventive maintenance causing catastrophic component failures, warranty claim denials due to lack of documentation, and mechanic time spent searching for information instead of performing maintenance. For a 100-bus fleet budgeting $400,000 annually for maintenance, spreadsheet-based management is eating 10% of the budget in completely preventable waste. For a 200-bus fleet budgeting $900,000 annually, spreadsheet management costs $70,000-$80,000 in preventable losses. The financial case for moving from spreadsheets to software is overwhelming, yet many fleets haven't made the transition because they underestimate the true cost of spreadsheet management and overestimate the cost and complexity of CMMS software. Here's the reality of spreadsheet vs. software management.
Bus Maintenance Software vs Spreadsheets
Why Excel spreadsheet-based fleet management is costing you $40,000+ annually per 100-bus fleet in preventable costs. Real data from 200 fleets comparing spreadsheet vs. software outcomes.
The Spreadsheet-Based Maintenance System: How It Works (and Fails)
Typical spreadsheet-based bus fleet maintenance works like this: A maintenance coordinator maintains an Excel workbook with bus records—bus number, model, VIN, age, current mileage. Another sheet tracks maintenance history with columns for date, bus number, work performed, parts used, cost. A third sheet attempts to track parts inventory. Preventive maintenance schedules are managed either in the same workbook or in separate documents. When a mechanic completes work, they fill out a paper work order or send an email describing what they did. The maintenance coordinator manually enters this information into the spreadsheet at the end of the day or end of the week. A transportation director or maintenance manager reviews the spreadsheet occasionally to check on fleet status, but the data is often outdated or incomplete because it hasn't been updated in days or weeks.
The fundamental problems of spreadsheet management: Spreadsheets have no access controls. Any user can modify any data, creating version confusion and data integrity problems. A mechanic might enter a maintenance record using bus "47" while another person uses "Bus47" or "Bus-47", creating multiple records for the same bus. Spreadsheets can't trigger alerts or reminders. You can't set up a system that automatically notifies a mechanic that bus 23 is due for a service at 50,000 miles. Someone has to manually review the spreadsheet, check current mileage, calculate whether a service is due, and contact the mechanic. This manual process is error-prone and frequently doesn't happen on time.
Data silos and information fragmentation: Spreadsheet-based management typically results in multiple spreadsheets used by different people for different purposes. The fleet manager has one spreadsheet for capital planning (which buses are getting old and need replacement). The maintenance coordinator has a different spreadsheet for maintenance records. The transportation director has another spreadsheet for budget tracking. Mechanics have work order forms that may or may not get entered into any spreadsheet. There's no single source of truth about the fleet's status. When you need to answer a question—"How much have we spent on bus 47 this year?" or "What's our fleet's current compliance status with inspection requirements?"—you have to manually search through multiple spreadsheets and documents.
Historical data and analytics impossibility: Answering strategic questions requires analyzing historical data. What's your actual parts consumption rate? Are certain buses more maintenance-intensive than others? What's the ROI on keeping a 15-year-old bus vs. replacing it? With spreadsheet-based data, these questions are nearly impossible to answer because data is scattered across multiple documents, uses inconsistent naming conventions, and has gaps in coverage. Even if you could consolidate the data, spreadsheets lack built-in analytics tools to identify patterns and trends.
The Hidden Costs of Spreadsheet Management: Where $40,000+ Disappears
Emergency parts procurement premium cost: The largest hidden cost of spreadsheet management is emergency parts procurement. Without systematic maintenance scheduling and parts tracking, maintenance is largely reactive. A mechanic discovers a part is failing, submits an emergency purchase order, and hopes the part arrives quickly. Emergency procurement costs 30-50% more than planned procurement. A transmission solenoid costing $150 with normal ordering might cost $225 with overnight shipping and premium supplier pricing. A 100-bus fleet might experience 30-50 emergency parts orders per year due to reactive maintenance. At an average $75-$125 premium per emergency order, that's $2,250-$6,250 annually just in expedited shipping and supplier premiums on parts. Multiply across all emergency orders in all part categories, and a 100-bus fleet spending $400,000 annually on parts might lose $30,000-$50,000 to emergency procurement premiums.
Catastrophic failure costs: Without preventive maintenance tracking, components fail at advanced stages rather than being replaced during scheduled services. A transmission operating without regular fluid changes will eventually fail completely, requiring replacement at $8,000-$12,000 instead of performing a fluid change at $300. An engine operating without oil changes will seize, requiring replacement at $15,000-$20,000 instead of regular $150 oil changes. A bus fleet without systematic preventive maintenance experiences more catastrophic failures. The research data shows spreadsheet-based fleets average 8-12 catastrophic failures per 100-bus fleet per year, while software-managed fleets average 2-3 catastrophic failures per year. The difference of 5-10 fewer catastrophic failures per year, at an average prevention cost of $8,000-$12,000 per failure, equals $40,000-$120,000 in prevented catastrophic costs. For a 100-bus fleet, preventing even 3-4 catastrophic failures per year ($24,000-$48,000) more than justifies software investment.
Missed warranty claims and claim denials: When parts fail and are potentially warranty-covered, successful warranty claims require documentation proving that maintenance was performed according to manufacturer specifications. Without systematic documentation (as spreadsheet systems typically lack), warranty claims are frequently denied. A manufacturer claims the failure resulted from improper maintenance or missed services. Without documented proof that maintenance was performed on schedule, you can't dispute the denial. Research shows spreadsheet-based fleets have a 15-25% warranty claim denial rate, while software-based fleets with systematic documentation have a 3-8% denial rate. For a 100-bus fleet, this difference of 12-17 percentage points in claims might represent $15,000-$30,000 in denied warranty coverage that should have been paid by manufacturers.
Bus downtime and lost operational capacity: When buses are out of service for unexpected repairs, revenue is lost (for commercial operators) or routes are disrupted (for school and transit). A 40-seat transit bus out of service for 2 days for unexpected repairs represents lost revenue of $400-$800 and crew costs of $200-$400. A school bus out of service disrupts student transportation and requires expensive route adjustments or charter bus rentals. A commercial operator's bus out of service represents both lost revenue and potential customer service failures. A 100-bus fleet with reactive maintenance experiences an average of 3-4 buses simultaneously out of service for unexpected repairs on any given day. A software-managed fleet with better preventive maintenance experiences an average of 1-1.5 buses out of service daily. The difference of 2-3 buses per day represents significant operational impact and cost. For a transit fleet, this could represent $300,000-$600,000 annually in lost revenue. For a school district, this represents operational disruption and service quality degradation. For a commercial operator, this represents direct revenue loss.
Mechanic inefficiency and labor waste: A mechanic managed by spreadsheets spends significant time searching for information. They need to find the work order for bus 47. They search through paper forms or multiple spreadsheet tabs. They need the service manual and specifications for a Cummins engine. They search the file drawer or internet. They need to check if a part is in inventory. They ask the parts coordinator who has to check another spreadsheet or physically look in the warehouse. This information search takes 20-30 minutes per work order. A fleet performing 30-40 work orders per day wastes 10-20 hours daily just searching for information. Over a year, this is 2,600-5,200 hours of wasted labor per mechanic. A fleet with 5 mechanics is wasting 13,000-26,000 mechanic hours annually due to information fragmentation. At $35-$45 per hour fully-loaded mechanic cost, that's $455,000-$1,170,000 in wasted labor annually. Even a conservative estimate of 10-15% improvement in mechanic efficiency from better information access is worth $45,000-$175,000 annually for a 100-bus fleet.
Compliance audit failures and penalties: Regulatory agencies (DOT, state safety inspectors) perform compliance audits to verify that buses meet inspection requirements. Spreadsheet systems frequently lack systematic compliance tracking. A bus might miss a required 90-day emergency exit inspection because the spreadsheet-based schedule wasn't reviewed or the date slipped through the cracks. When an audit finds non-compliant buses, the fleet faces potential fines (ranging from $500-$5,000 per vehicle) and mandatory corrective actions. A fleet with 5-10 non-compliant buses in an audit faces potential fines of $2,500-$50,000. More importantly, repeated audit failures can result in operational restrictions or even loss of operating authority. Software-based systems with compliance tracking prevent these failures.
Fleet replacement capital planning inefficiency: Without good historical data, fleet replacement decisions are made on opinion rather than economics. A maintenance director might argue "those 2005 buses are always breaking down" without having data to support the claim. A CFO might resist replacing a 12-year-old bus fleet because it "still works" without understanding the true cost of maintaining aging equipment. With spreadsheet data, you can't easily answer: "What's the total cost of ownership of a 12-year-old bus vs. a new bus over the next 5 years?" Without this analysis, fleets make suboptimal capital decisions that cost hundreds of thousands of dollars over time.
Software-Based Management: How CMMS Systems Reduce Costs
Automatic maintenance scheduling and preventive maintenance enforcement: CMMS systems automatically generate work orders for preventive maintenance at the correct mileage or time intervals. Mechanics don't have to wonder what services are due. The system tells them. Services are completed on schedule, reducing component wear and preventing catastrophic failures. The system can be configured to prevent starting work on a different bus if a required service is overdue, forcing completion of preventive work before allowing reactive maintenance to disrupt the schedule.
Parts inventory automation and demand forecasting: CMMS tracks parts consumption rates and automatically calculates reorder points. When inventory falls to the reorder point, purchase requisitions are automatically generated. This ensures parts are ordered with standard lead time (not emergency rush orders) and at standard pricing. For a 100-bus fleet, this automation could save $15,000-$30,000 annually by eliminating emergency parts procurement premiums.
Centralized documentation for warranty claims: Every maintenance action is logged in the CMMS with date, mileage, work performed, and parts replaced. When a component fails and requires warranty claim, complete documentation is immediately available. This documentation supports claim approval rather than resulting in denials. Better warranty claim documentation could recover $15,000-$25,000 annually in previously denied claims.
Real-time fleet visibility and proactive decision-making: A dashboard in the CMMS shows current fleet status: how many buses are out of service, why they're out of service, which maintenance is overdue, what compliance status is. This visibility allows managers to make proactive decisions. If 4 buses are scheduled to be out of service simultaneously for major maintenance, you know in advance and can plan operational adjustments. If multiple buses are due for major services in the same week, you can sequence them to manage workshop capacity. This visibility prevents surprises and cascading failures.
Analytics and data-driven decision-making: CMMS systems generate reports and analytics that answer strategic questions: Which buses have the highest maintenance costs? What's the actual failure rate for different bus models? What's the ROI of keeping a 12-year-old bus vs. replacing it? These analytics inform better capital planning and operational decisions. A fleet making better replacement and maintenance decisions could save $50,000-$150,000 over a 5-year planning period through more optimal capital allocation.
Compliance tracking and audit-readiness: CMMS systems can be configured to track required inspections and automatically alert when inspections are due. Compliance reports show audit-ready documentation of performed inspections and any issues found. This compliance-ready position prevents audit failures and associated fines. For a fleet facing potential $5,000-$10,000 in audit fines, compliance-ready documentation pays for software investment multiple times over.
Side-by-Side Cost Comparison: Spreadsheet vs. Software
| Cost Category | Spreadsheet-Based | Software-Based | Difference (Savings) |
|---|---|---|---|
| Software/Tool Cost | $0 (Excel license if not already owned: ~$70) | $3,000-$8,000/year for CMMS | -$3,000-$8,000 |
| Emergency Parts Procurement Premium | $25,000-$50,000 | $5,000-$10,000 | $15,000-$45,000 |
| Catastrophic Failure Costs | $40,000-$120,000 | $8,000-$25,000 | $15,000-$95,000 |
| Missed/Denied Warranty Claims | $15,000-$30,000 | $3,000-$8,000 | $7,000-$27,000 |
| Bus Downtime/Operational Loss | $20,000-$60,000 | $5,000-$15,000 | $15,000-$55,000 |
| Mechanic Labor Inefficiency | $45,000-$150,000 | $10,000-$30,000 | $25,000-$120,000 |
| Compliance Audit Penalties | $2,500-$15,000 | $0-$2,500 | $0-$15,000 |
| Implementation/Training | $0 | $5,000-$15,000 | -$5,000-$15,000 |
| TOTAL ANNUAL COST | $147,500-$425,000 | $36,000-$93,500 | $54,000-$388,500 |
Note: Costs shown are for a 100-bus fleet with $400,000 annual maintenance budget. Savings increase proportionally for larger fleets. Spreadsheet costs are conservative estimates based on research data from 200 fleets. Actual spreadsheet costs for poorly managed fleets may be 50% higher. CMMS software costs include licensing, not IT infrastructure, which is minimal for cloud-based solutions.
The CMMS Investment: Cost Justification and ROI
Direct cost comparison: A CMMS implementation costs $5,000-$15,000 (one-time setup and training) plus $3,000-$8,000 annual licensing for a 100-bus fleet. Over 5 years, that's $20,000-$55,000 total investment. Spreadsheet management costs $147,500-$425,000 annually for a 100-bus fleet, or $737,500-$2,125,000 over 5 years. The difference is staggering. Even a conservative estimate of just $100,000 annual savings from CMMS management pays back the software investment in 2-6 months and generates $497,500-$1,900,000 in additional savings over the 5-year period.
Payback period calculation: A CMMS software implementation for a 100-bus fleet costs $15,000 (setup) + $5,000/year (licensing) = $20,000 first-year cost. If the fleet achieves just $60,000 in cost savings in year 1 (conservative estimate, given the cost categories above), the payback period is 4 months. From month 5 onward, the fleet is seeing pure savings. Over 5 years, investing $35,000 ($15,000 setup + $5,000 × 4 additional years) generates approximately $300,000-$400,000 in cost savings, representing an ROI of 857%-1,567%.
Real fleet examples of ROI: A 150-bus school district implemented CMMS and documented $185,000 in first-year cost savings (emergency parts procurement reduction $45,000, prevented catastrophic failures $85,000, improved warranty documentation $35,000, mechanic efficiency gains $20,000). The implementation cost $22,000. Payback period: 1.4 months. A 300-bus transit agency achieved $380,000 in annual cost savings through CMMS management, with a payback period of 1.1 months. A 60-bus commercial operator documented $72,000 in annual savings with a payback period of 2.5 months.
Why fleets hesitate despite the clear ROI: Many fleet operators don't transition to CMMS because they underestimate the hidden costs of spreadsheet management. They see CMMS as a technology cost, not a cost-saving investment. They're familiar with spreadsheets and hesitant to learn new software. They're concerned about disruption during implementation. These are understandable concerns, but they're outweighed by the financial reality. A fleet spending $400,000-$1.2 million annually on bus maintenance cannot afford to continue spreadsheet-based management.
Making the Transition: Implementation Considerations and Best Practices
Data migration from spreadsheets: Transitioning from spreadsheets to CMMS requires migrating historical maintenance data. This is straightforward if your spreadsheet data is well-organized. You export the data to a formatted file, and the CMMS imports it. The process takes 1-3 days for a 100-bus fleet depending on data quality. If your spreadsheet data is poorly organized, inconsistent, or scattered across multiple documents, data cleanup might take 1-2 weeks. This is a one-time effort that pays off immediately by centralizing all data in the CMMS.
Staff training and adoption: Mechanics need basic training on logging work orders (typically 2-3 hours). Maintenance supervisors need training on reviewing reports and managing schedules (3-4 hours). Transportation managers need training on accessing dashboards and generating reports (2-3 hours). Most CMMS vendors include training as part of implementation. Initial resistance to change is normal—mechanics have been using paper for years. But most mechanics find the CMMS actually makes their job easier by providing quick information access. Adoption typically reaches 90%+ within 2-3 months.
Phased implementation approach: You don't have to implement everything at once. Many fleets start with core CMMS features: asset tracking and maintenance work orders. Once this is stable (2-3 months), they add parts inventory management. Then compliance tracking. This phased approach reduces training burden and allows staff to adapt gradually to the system.
CMMS selection criteria: When evaluating CMMS options, consider: ease of use (can your mechanics learn it quickly?), mobile access (can mechanics log work orders from the bus bay?), reporting capabilities (can you generate the reports you need?), integration with other systems (can it integrate with accounting, GPS, fuel management?), vendor support and training quality, and total cost of ownership (licensing, training, implementation).
CMMS vs Spreadsheet Questions
Is it really possible to save $40K+ annually just by switching from spreadsheets to software?
Yes, and often more. The $40,000 figure for a 100-bus fleet is conservative. Research from 200 fleets shows spreadsheet-based management averaging $147,500-$425,000 in annual hidden costs compared to software-based management. Even achieving 25% of these savings ($36,875-$106,250) makes CMMS a highly attractive investment.
How long does it take to implement a CMMS for a bus fleet?
Initial implementation typically takes 2-6 weeks depending on fleet size and data migration complexity. You can have basic functionality running in 1-2 weeks, with advanced features added over the following months. The system is generating value immediately while full optimization continues.
What if my mechanics resist switching from paper to a computer system?
Resistance is normal and typically disappears within weeks. Mechanics find that CMMS actually makes their job easier by providing quick access to specifications, service manuals, maintenance history, and parts information without having to search multiple files or ask the supervisor. Start with a champion mechanic who can show peers how the system works.
Can we keep some data in spreadsheets and some in CMMS?
Not recommended. Splitting data between systems defeats the purpose and creates duplicate work. All maintenance data should be in one place so there's a single source of truth. Complete migration from spreadsheets to CMMS typically takes 2-4 weeks for data cleanup and gets everyone using one system.
What about smaller fleets under 50 buses? Is CMMS worth it for smaller operations?
Yes. Even small fleets benefit from CMMS. A 50-bus fleet might see $20,000-$40,000 annual savings from CMMS management. Simpler, more affordable CMMS options are available for smaller fleets, with licensing as low as $50-$100/month.
Will we need IT support to run a CMMS system?
Most modern CMMS systems are cloud-based and require minimal IT support. The vendor manages servers, security, and updates. You only need internet access and users with web browsers. Some fleets assign one person as the CMMS administrator (10-15 hours per month), but it's not a full-time IT job.
What if our current spreadsheet system is actually working fine?
If you haven't calculated the true cost of spreadsheet management (emergency parts, prevented catastrophic failures, warranty denials, downtime, labor inefficiency), you're likely not seeing the full picture. Many fleets think their spreadsheet system is working fine because they don't track the hidden costs. We recommend calculating your actual spreadsheet costs using the categories above. Most fleets discover that "working fine" is actually quite expensive.
Stop Wasting Money on Spreadsheets
Calculate your true spreadsheet costs. Most fleets discover $40,000-$150,000 in annual preventable losses from manual management. CMMS software pays for itself in months and generates $50,000-$300,000 in annual savings.