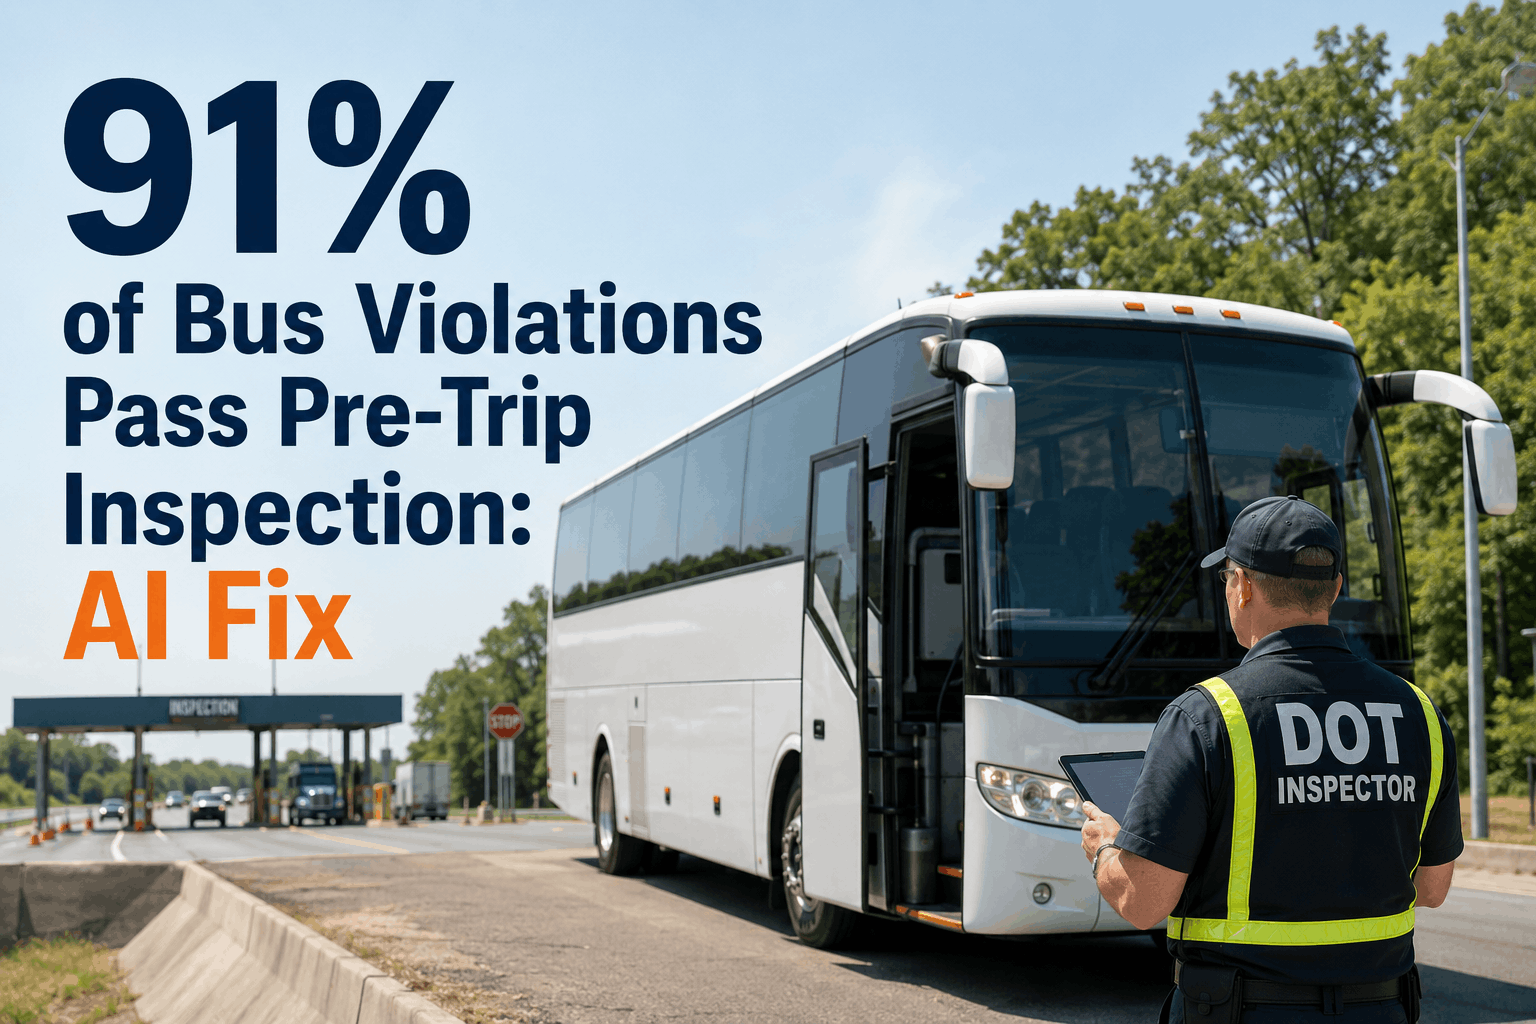
At 6:58 a.m. on a Wednesday in March, a driver at a central Texas school district completed Bus 17's pre-trip inspection and signed off on all items. Brakes: checked. Lights: checked. Tires: checked. Eleven minutes later, the bus left the yard carrying 41 students. Four hours into the route, a CVSA-certified roadside inspector in San Antonio placed Bus 17 out of service for a brake adjustment violation - the pushrod on the right rear axle had exceeded maximum stroke under load. It was not detectable on a visual walk-around. It developed progressively during the morning run, under heat and repeated braking cycles. The driver followed every procedure correctly. The pre-trip form was complete. The bus was still removed from service with 41 students aboard, $15,600 in fines, a CSA score impact lasting 24 months, and a call to parents that no school district wants to make. This incident is not exceptional. According to CVSA data, 91% of commercial vehicles placed out of service during roadside inspections had a completed, signed pre-trip inspection on file from that same day. The pre-trip did not fail. The pre-trip was physically incapable of detecting what failed. That gap - between what a driver can check with eyes and hands in 11 minutes and what a roadside inspector finds with tools and instrumentation - is the most dangerous compliance blind spot in bus fleet management. BusCMMS AI inspection was built specifically to close it.
See how BusCMMS AI inspection catches what pre-trip misses - book a live demo
91% of Bus Roadside Violations Pass Pre-Trip Inspection: The AI Fix
CVSA data confirms 91% of out-of-service buses had a signed pre-trip that same day. AI inspection scans 3,000+ data points drivers physically cannot - closing the gap before a roadside inspector does.
What CVSA Roadside Data Actually Shows About Pre-Trip Inspection Failures
Every year, the Commercial Vehicle Safety Alliance conducts its International Roadcheck - a 72-hour enforcement blitz involving CVSA-certified inspectors across every U.S. state, Canada, and Mexico. In 2025, inspectors conducted 56,178 inspections and placed 10,148 commercial motor vehicles out of service, an 18.1% vehicle out-of-service rate. In 2024, the number was even higher: 23% OOS across 48,761 inspections. These are not vehicles whose drivers skipped their pre-trip. These are vehicles that left the yard with completed, signed driver vehicle inspection reports - and were still found to have critical safety violations hours later. The 91% figure is not a failure of driver effort or intent. It is a structural failure of what manual visual inspection is physically capable of detecting in the time and conditions under which it occurs.
What these numbers reveal is that the top three violation categories - brakes, tires, and lighting - account for over 85% of all out-of-service orders, and all three have components that are genuinely undetectable during a manual visual pre-trip under real-world time pressure. A brake pushrod at 97% of maximum stroke looks identical to one at 50%. A tire with developing internal sidewall separation looks normal from outside. An electrical connection developing resistance before complete failure passes a visual lamp check. The gap is not negligence. It is physics. Schedule a demo to see what BusCMMS AI inspection catches that pre-trip physically cannot.
Why Manual Pre-Trip Bus Inspections Cannot Prevent Roadside Out-of-Service Orders
The FMCSA-required pre-trip inspection under 49 CFR 396.11 was designed as a minimum safety floor - not a comprehensive diagnostic system. The regulation requires drivers to inspect the vehicle and report any defects that would affect safe operation or result in a mechanical breakdown. What it cannot require is that drivers detect defects that are below the threshold of human visual perception, that only manifest under operating load and temperature, or that require measuring instruments to identify. The average bus pre-trip inspection takes 11 minutes for 40+ inspection items - less than 17 seconds per item, including walk-around time. In that window, here is what physically cannot be done:
Brake Pushrod Stroke Measurement
Maximum stroke limits require physical measurement with a ruler or stroke indicator. A brake chamber at 95% of its limit looks identical to one at 50% - no visual indication until it fails completely under load.
Tire Internal Condition
Belt separation, internal cracking, and structural weakness are invisible externally. Tread depth requires a gauge to measure accurately. Visual inspection passes tires that a properly equipped inspector flags. Tire violations cause 53.5% of all roadside breakdowns in the USA.
Developing Electrical Faults
A corroded lighting circuit with high resistance still lights the lamp during a static pre-trip check. Under operating vibration and temperature, the connection fails. Fleets using digital AI inspection catch 73% more lighting defects before they become violations.
Load-Dependent Brake Performance
Air brake adjustment issues frequently develop under load and heat after repeated stopping cycles. A brake that passes a static check may develop an out-of-adjustment condition by the third or fourth stop on a loaded morning run.
Suspension and Steering Wear
Worn steering components and suspension bushings within legal limits can degrade rapidly under daily route loads. Visual inspection cannot quantify wear percentage or detect components approaching the out-of-service threshold before they reach it.
Documentation Gaps Under Time Pressure
FMCSA data shows "pencil whipping" - signing off without completing the inspection - is endemic across the industry, particularly on early-morning routes. Without a guided, time-stamped digital process, incomplete DVIRs become an invisible compliance liability.
How BusCMMS AI Inspection Covers the 3,000+ Data Points Manual Pre-Trip Misses
General-purpose CMMS platforms and standard digital inspection apps do the same thing manual pre-trip does, just on a screen. They prompt drivers to check items and record responses. They do not add diagnostic capability. BusCMMS AI inspection operates differently. It combines driver-guided visual checks with AI photo analysis, vehicle sensor data integration, and historical trend comparison across your fleet to detect defects at a stage where a visual walk-around produces a false pass - exactly the stage where 91% of roadside violations originate. Sign up free and deploy AI inspection across your fleet this week.
Guided Walk-Around with AI Photo Analysis
BusCMMS prompts drivers through every inspection point with specific photo requirements for each component. AI analyzes submitted photos for wear patterns, misalignment, leaks, and damage that pass visual inspection. Brake lining thickness, tire sidewall condition, and lighting seal integrity are all flagged before drivers complete the form.
Vehicle Sensor and OBD Integration
BusCMMS connects to onboard diagnostic systems to pull real-time sensor readings - air brake system pressure, ABS fault codes, coolant temperature trends, electrical system load - at the time of inspection. Developing faults that produce no outward symptom generate immediate inspection flags and auto-created work orders before they escalate to OOS criteria.
Fleet-Wide Trend Detection
Every completed inspection feeds a fleet-level AI model that identifies trend degradation - a brake component on Bus 7 declining at the same rate that historically precedes an OOS violation on that vehicle class, or a tire pressure pattern on Bus 12 that matches pre-failure profiles from 200+ documented roadside violations in the BusCMMS database.
Instant Work Order and Dispatch Flag
When AI inspection flags a developing defect, BusCMMS automatically creates a prioritized work order, assigns it to the correct technician, and marks the bus unavailable for dispatch until the work order is closed with a certified repair. The entire loop - from AI flag to dispatch lockout to repair documentation - requires zero manual coordination from fleet management.
The Real Cost of One Bus Roadside Out-of-Service Order in the USA
Fleet managers tend to think of roadside violations in terms of the fine. The fine is the smallest part of the total cost. Each out-of-service order triggers a cascade of consequences that compound over 24 months - the duration of a CSA BASIC score impact - and affects your fleet's insurance rates, operating authority, and ability to win contracts with school districts and transit agencies that audit carrier safety scores. Understanding the full cost structure is how you calculate the ROI of AI-powered pre-trip inspection against its actual alternative. Book a demo to see the cost-reduction math on your fleet size.
The average out-of-service violation costs $4,200 in direct penalties and emergency repairs alone - before insurance impact, CSA consequences, or the downstream contract and authority risk. BusCMMS AI inspection costs a fraction of one OOS event per year across an entire fleet. Start your free trial and deploy AI inspection before your next CVSA event.
Manual Pre-Trip vs AI-Assisted Inspection: Side-by-Side Coverage
The comparison below reflects FMCSA inspection protocols, CVSA roadside inspection criteria, and BusCMMS AI inspection coverage across all major out-of-service violation categories. Every "Limited" or "Not Covered" row in the manual column represents a documented out-of-service violation category that a signed, completed pre-trip inspection failed to catch in 91% of cases.
| Inspection Category | Manual Pre-Trip | Standard Digital DVIR | BusCMMS AI Inspection |
|---|---|---|---|
| Brake pushrod stroke measurement | Not measurable visually | Driver self-reports | AI sensor + photo analysis |
| Brake lining thickness | Limited visual only | Driver estimate | AI image measurement |
| Tire internal condition / structure | Invisible externally | Driver self-reports | AI sidewall analysis |
| Lighting circuit resistance / faults | Static check only | Static check only | OBD live circuit data |
| Air brake pressure decay rate | Not measured | Not measured | System sensor integration |
| Suspension / steering wear grade | Visual estimate only | Driver estimate | AI photo + trend data |
| Historical defect trend by vehicle | None | None | Full fleet history AI model |
| FMCSA-compliant DVIR auto-generated | Manual paper form | Driver-completed digital | Auto-generated, timestamped |
| Work order auto-created on defect | No | Manual submission | Instant, auto-assigned |
| Dispatch lockout on OOS-risk defect | No | No | Automatic until resolved |
Why General CMMS Tools and Standard Digital Forms Do Not Solve the 91% Problem
Platforms like OxMaint, Hippo CMMS, and general fleet management software offer digital pre-trip forms that replace paper with screens. They do not change the fundamental limitation: the inspection is still only as thorough as what a driver can see and report. A driver recording "brakes OK" on a tablet produces the same result as a driver recording "brakes OK" on paper - because neither has the tools, training, or time to detect a brake pushrod approaching maximum stroke during an 11-minute walk-around. BusCMMS is purpose-built for bus fleet compliance. It was designed specifically around FMCSA bus requirements, CVSA inspection criteria, and the documented failure modes that generate bus out-of-service orders in the USA - not adapted from a general manufacturing CMMS or warehouse inventory system. The AI inspection layer is not a form. It is a diagnostic system that happens to also complete your DVIR. See the difference in a live demo on a real bus fleet configuration.
91% of OOS Buses Had a Passing Pre-Trip.
None of Them Had AI Inspection.
BusCMMS AI inspection closes the gap between what a driver can see and what a roadside inspector will find. Photo analysis, sensor data, fleet trend AI, instant work orders, and FMCSA-compliant DVIRs - built exclusively for bus fleets.







