You know the number before you pull the report: the open work orders have been climbing for months. Overdue PMs, repairs deferred "just until next week," buses waiting on a part. A bus maintenance backlog does not announce itself — it quietly eats fleet availability until a board meeting asks: when will we be caught up? A recovery plan answers that with a date, not a shrug. You can see a live backlog burn-down in a short demo.
STRATEGY · SHOP RECOVERY
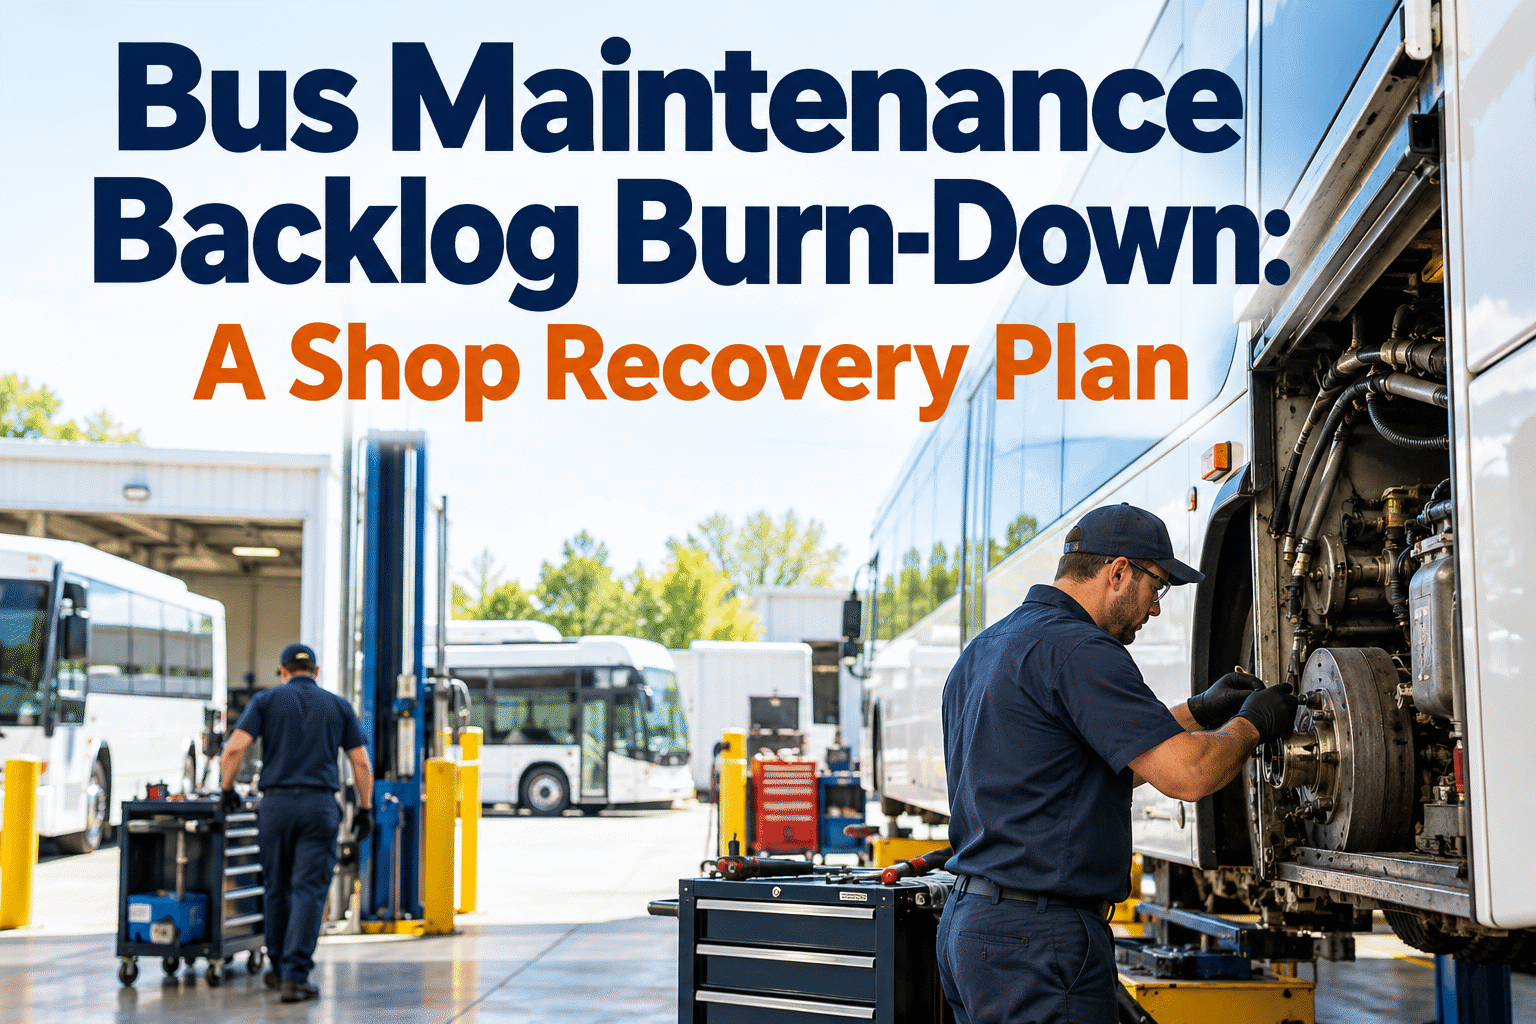
Bus Maintenance Backlog Burn-Down: A Shop Recovery Plan
A backlog you cannot measure is a backlog you cannot beat. A burn-down plan turns the pile of overdue work orders into a line that bends down week by week — with a target, a pace, and a date you can take to the board. Here is how to build it.
THE BACKLOG BURN-DOWN
Illustrative 12-week recovery. The point of a burn-down is not speed — it is a visible, trackable line that tells you and your board whether the backlog is actually shrinking, and when it hits a healthy level.
Why a Bus Maintenance Backlog Grows Faster Than You Think
A backlog is rarely one big failure. It is a slow accumulation — a PM pushed a week, a repair deferred, a bus parked on a part. Each feels manageable alone. Together they become a pile deep enough that fleet availability slips and the oldest work orders are months overdue.
WHAT IS ACTUALLY IN THE BACKLOG
Illustrative mix. Overdue PMs and parts delays usually dominate — which matters, because you attack a backlog differently depending on what it is made of. You cannot wrench your way out of a parts problem.
The Capacity Gap: Why the Backlog Won't Shrink on Its Own
Here is the math most shops miss: if new work comes in faster than you close it, the backlog grows no matter how hard the crew works. Burning it down means closing more work orders per week than you create — until that gap flips, you are treading water.
CREATED VS CLOSED, PER WEEK
Illustrative weekly rates. The recovery is not about one heroic week — it is about holding a completion rate above your intake rate, week after week, until the line hits target.
That is why a recovery plan sets a weekly close-rate target, not a finish date pulled from the air. Work the gap and the date takes care of itself — worth a demo to see completion rate tracked against intake.
The Four-Step Backlog Recovery Plan
A recovery plan is not "work harder." It is four moves, in order, that turn an overwhelming pile into a weekly routine the shop can sustain — and a director can report on with real numbers.
1
Measure the hole in hours, not count
A count of open work orders hides the real size. Measure the backlog in labor-hours — a half-hour fix is not the same as a full-day repair — so you know how many crew-weeks you are behind.
2
Prioritize safety and overdue PMs first
Not all backlog is equal. Safety defects and the most overdue PMs come first — a deferred PM is a road call waiting to happen, which makes the backlog worse when it blows up on a route.
3
Set a weekly close-rate target
Pick a number of work orders (or hours) to close each week that beats your intake rate. That gap is your burn-down speed — it turns "when will we catch up?" into arithmetic you can commit to.
4
Protect the plan from new fires
The plan dies if every new emergency steals the catch-up hours. Reserve recovery capacity, triage new work, and keep the backlog queue visible so nothing quietly ages past the point of no return.
Once the plan is set, recovery is a weekly rhythm. Run this short list each week and the burn-down keeps bending the right way — and you always have the numbers ready when someone asks for a status.
Did we close more than we created?The one number that matters — if completion beat intake, the backlog shrank this week.
KEY
Are the oldest work orders moving?Watch the aging buckets — a shrinking total hides a problem if the 90-day-old jobs never budge.
KEY
Any overdue PMs slipping further?Overdue preventive maintenance is the backlog that bites back — keep it from aging into road calls.
KEY
What is stalled on parts?Pull parts-blocked jobs out of the shop queue so they do not look like a technician problem they are not.
TRACK
Did recovery hours get protected?Confirm the catch-up capacity was not fully eaten by new emergencies — if it was, the plan stalls.
A recovery plan lives or dies on visibility. BusCMMS keeps the backlog in front of you as a live, sortable queue — aged, prioritized, and measured — so the burn-down is something you manage daily instead of a report you dread building.
Aged work-order queue
Every open work order sorted by age and priority, so the oldest and most critical jobs surface instead of hiding.
Completion rate vs intake
A live dashboard shows work created against work closed each week, so you know whether the backlog is growing or shrinking.
Overdue PM flags
PM past its mileage or date trigger is flagged automatically, so overdue PMs get caught up before they turn into road calls.
Parts-blocked jobs separated
Jobs stalled on a part are tracked apart from shop work, so a purchasing delay is never counted as a technician falling behind.
95%+fleet availability — BusCMMS's own reported customer result once backlog is under control25–35%maintenance cost reduction within 12 months, as reported by BusCMMS2–4 wkstypical rollout — bus-specific, so recovery tracking starts fast
Those are BusCMMS's own reported figures from customer data, and the connection is direct: a backlog you can see and measure is one you can actually burn down, and availability climbs as it shrinks.
A Maintenance Supervisor's Take
Key Takeaways on Bus Maintenance Backlog Recovery
A bus maintenance backlog is beatable once you can see it and set a pace. Four things to hold onto.
01
Measure before you dig
Backlog in labor-hours, not a work-order count — that is how deep you really are.
02
Close more than you create
The backlog only shrinks when completion beats intake — that gap is your pace.
03
Know what it's made of
Parts delays need purchasing, not wrenches — attack each slice the right way.
04
Protect the plan
Reserve catch-up hours, or new fires quietly eat the whole recovery.
Build the burn-down, hold the close rate above intake, and protect the hours — and a bus maintenance backlog goes from a source of dread to a line on a chart heading where you want it. The work is the same; now you can see it winning.
FAQ
Bus Maintenance Backlog Recovery: Common Questions
What is a bus maintenance backlog burn-down?+
A burn-down tracks a maintenance backlog as a line that falls over time toward a target. You chart open work orders week by week, set a healthy backlog level as the goal, and watch whether the line is bending toward it. Borrowed from project management, it works for a bus shop because it answers the question everyone keeps asking — "are we catching up, and when?" — with a visible trend, not a gut feeling. The plan sets the pace; the burn-down shows whether you are holding it. The goal is usually not zero backlog but a healthy level where the oldest work orders stay current and availability holds.
How do I reduce a bus maintenance backlog?+
In four moves. First, measure the backlog in labor-hours, not a count — a half-hour fix and a full-day repair are not the same size, and hours tell you how many crew-weeks you are behind. Second, prioritize: safety defects and the most overdue PMs first, because a deferred PM tends to become a road call that makes the backlog worse. Third, set a weekly close-rate target that beats your intake rate — that gap is how fast it shrinks. Fourth, protect the recovery hours so new emergencies do not eat the catch-up capacity. The common thread is visibility: you cannot manage a backlog you cannot see, so getting every open work order onto one aged, prioritized queue is the foundation.
Why does a maintenance backlog keep growing?+
Because new work comes in faster than the shop closes it. This is the capacity gap, the single most important thing to understand about a backlog: if you create 22 work orders a week and close 16, the backlog grows by 6 every week no matter how hard the crew works. Parts delays, piled-up overdue PMs, and new emergencies stealing catch-up hours stack on top. The backlog will not shrink until completion is pushed above intake and held there. That is why "work harder" is not a plan; the plan is to close the gap and protect it, week after week, until the line reaches a healthy level.
Should I measure backlog by work-order count or by hours?+
By hours. A count of open work orders is easy to pull but misleading — forty quick jobs and forty full-day repairs show the same number but mean wildly different amounts of work. Labor-hours tell you the real size: how many technician-weeks you are behind, which is what you need to set a realistic pace and an honest finish date. Hours also make the capacity math work — you compare the hours arriving each week against the hours your crew can turn. A count still helps for spotting aging, but for sizing the hole and planning the dig-out, hours is the honest measure.
How does BusCMMS help with backlog recovery?+
BusCMMS makes the backlog visible and measurable, which is the hard part. Every open work order sits on one queue sorted by age and priority, so the oldest and most critical jobs surface instead of hiding. A live dashboard tracks work created against work closed each week, so you see in real time whether the backlog is growing or shrinking — the completion-versus-intake number the whole recovery turns on. Overdue PMs are flagged before they age into road calls, and parts-stalled jobs are tracked separately so a purchasing delay never looks like a technician falling behind. BusCMMS reports customer fleet availability of 95% or higher and cost reductions of 25 to 35% within 12 months — company-reported figures from its own data, both moving the right way as a backlog comes under control.