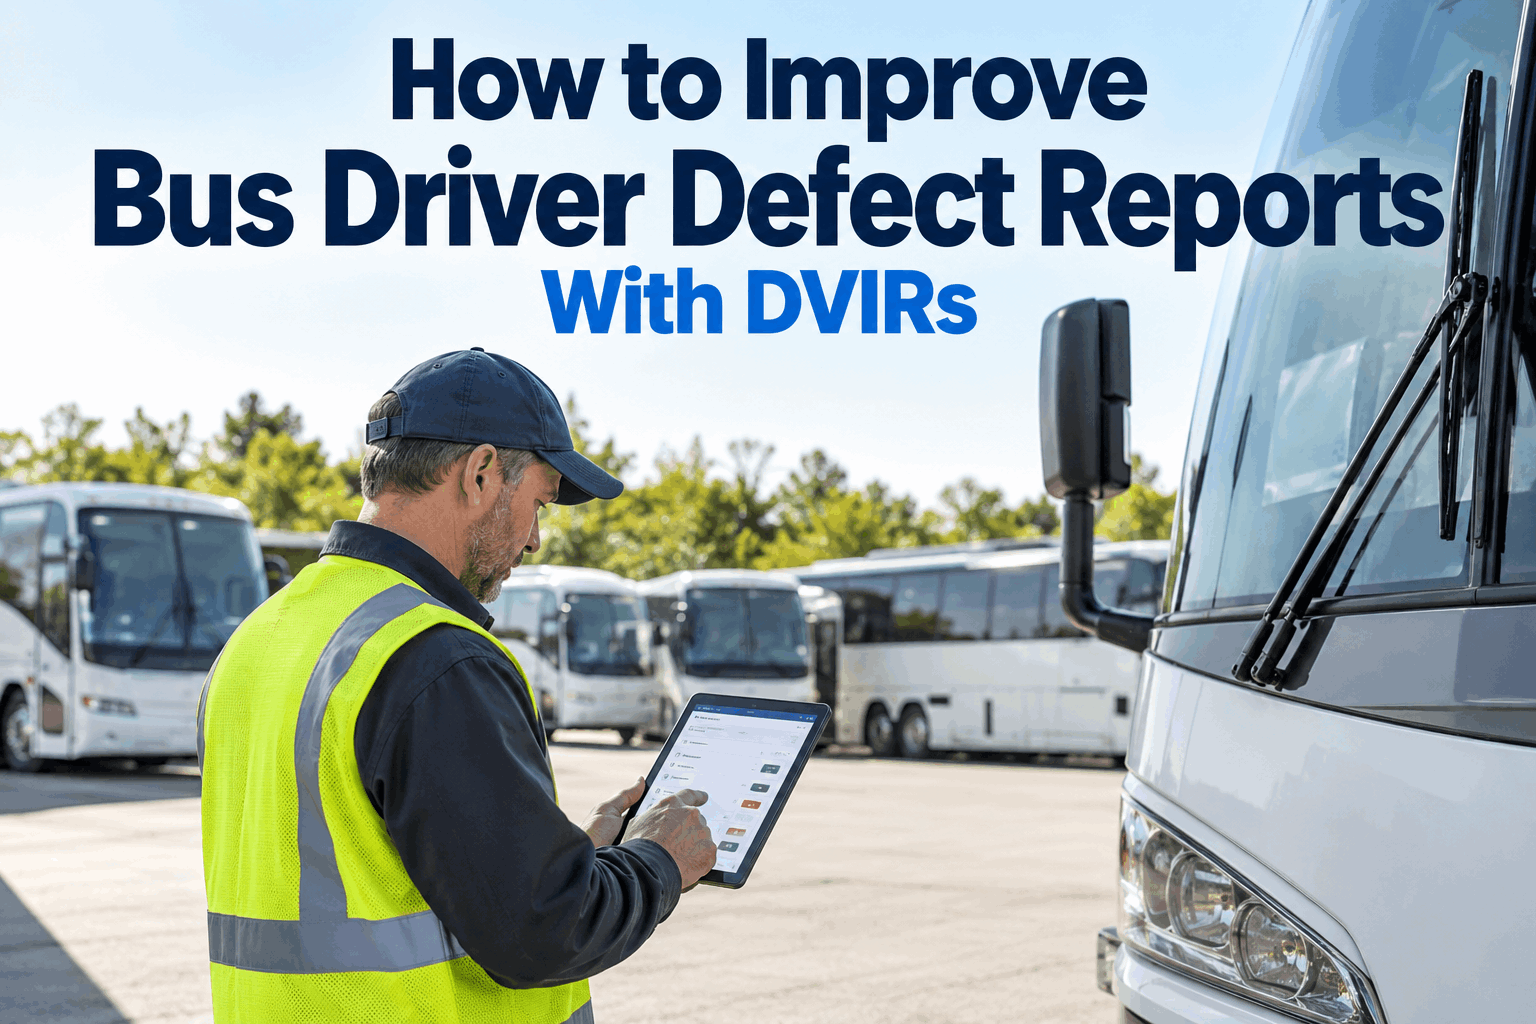
A driver hands in a DVIR that says "brakes feel weird." The technician reads it, sighs, and walks out to find the driver — who has already left for the day. Now the bus sits until someone can call the driver at home to ask what "weird" means. Was it a squeal? A pull? A soft pedal? A vibration? Each one is a completely different diagnosis and repair path. This guide covers how to improve bus driver defect reports so a report actually tells the shop what is wrong — through structured DVIR prompts, coaching, and the small workflow changes that turn vague notes into actionable diagnostics.
How to Improve Bus Driver Defect Reports With Better DVIRs
Structured prompts, coaching without punishment, and the DVIR fields that turn "something feels off" into a real diagnostic starting point.
- 5Report fields
- 4Coaching tiers
- 396.11Compliance floor
"Brakes feel weird"
Why Vague Bus Driver Defect Reports Are Actually a Tool Problem
Vague defect reports look like a driver problem — someone was rushed, someone did not care, someone did not know the right vocabulary. But look at the DVIR form most drivers fill out and it is a blank text box under a checkbox. There is no prompt asking where the noise was, when it happened, under what conditions. The tool asks for a sentence and gets a sentence. Drivers are not writing bad reports on purpose. They are writing reports the tool did not help them write well.
Under 49 CFR 396.11, a DVIR must list "any defect or deficiency" that would affect safe operation. But the regulation says nothing about report quality — only that the report exists. Compliance passes with "brakes feel weird." Diagnostics don't. The gap between the regulatory floor and the operational bar is what a good digital DVIR closes.
There is a real cost to bad reports. A technician who cannot act on a defect report has to walk out, find the driver, ask what they meant, then diagnose from scratch. If the driver has already gone home, the bus sits — either pulled from tomorrow's route or dispatched anyway with the "weird" issue unresolved. Neither is a good outcome, and both trace back to a report field that should have been structured but was left as an open text box. Book a walkthrough to see structured defect prompts inside the driver DVIR flow.
Anatomy of a Good Bus Defect Report
A defect report that a technician can act on without a phone call answers five questions. Every one of them is easy for a driver to answer when the DVIR asks the question — and almost impossible to answer in an unstructured free-text box.
The fifth field — evidence — is what a paper DVIR could never do and a modern digital DVIR does trivially. A photo of the crossing gate that is bent, a short audio clip of the brake squeal, a video of the wheelchair lift stalling mid-cycle. The evidence eliminates the "what did you mean?" phone call entirely. Bus-specific inspection items (stop arms, crossing gates, student mirrors, wheelchair lifts, 8-light warning systems) benefit disproportionately here because a photo of the mechanism is worth several paragraphs of text description.
The Vague-Phrase Field Guide: What Drivers Say vs What the DVIR Should Ask
Six phrases dominate vague defect reports. The pattern is remarkably consistent across school district and transit fleets. For each one, a good digital DVIR responds not with "please add more detail" but with a specific follow-up prompt the driver can actually answer.
"Brakes feel weird"
Squeal, grind, vibration, pull, or soft pedal?
"Bus is loud"
Noise from engine, drivetrain, cabin, or exhaust?
"AC not working"
No airflow, warm airflow, or intermittent? Which vents?
"Steering off"
Pull left, pull right, loose, tight, or vibration?
"Lift issue"
Won't deploy, won't stow, slow cycle, or safety belt fault?
"Warning light"
Which light? On steady or flashing? Photo of dash cluster?
Every one of these prompts takes the driver a few seconds to answer and gives the technician a hypothesis to start with. None require additional driver training — the DVIR itself is the training. The driver learns which questions matter by being asked them every time. Sign up free and see the guided-prompt DVIR flow running on your fleet.
The Prompt Cascade: How a Good DVIR Walks a Driver Through It
A well-designed digital DVIR is not a text box — it is a short guided interview. Four cascade steps take the driver from "something is wrong" to a fully specified report in under a minute.
Component Picker
Driver taps the affected system: brakes, steering, HVAC, lights, stop arm, wheelchair lift, doors, mirrors, etc. Bus-specific list — not a truck DVIR.
Symptom Taxonomy
Based on the component, only the relevant symptoms surface. Brakes get squeal / grind / pull / soft pedal. Lift gets won't deploy / won't stow / slow cycle. No irrelevant options.
Context Prompt
When does it happen? Cold start / above 25 mph / every time / intermittent. One tap, meaningful diagnostic input.
Evidence Capture
Take photo / audio / short video. Automatic bind to the defect record. Timestamp and GPS captured. Report submits.
The important design principle: the driver never sees a blank text field until step 4 (the optional free-text note). Every earlier step is a tap on a pre-defined option. This is faster than typing and produces categorized, searchable data the shop can filter and trend. A "same component + same symptom" pattern across three buses jumps out immediately — something a free-text field could never surface without months of manual reading.
Coaching Without Punishing: The 4-Tier Escalation
Structured prompts get 80% of the way there. The remaining 20% is coaching — and coaching goes wrong when it feels punitive. A driver who thinks the DVIR is a way to get written up will file the shortest possible report every time. Four tiers of coaching keep the tone constructive while still surfacing real quality issues.
The Prompt Itself
The DVIR prompts a fuller answer in the moment. "Squeal or grind?" — the driver picks one and moves on. Zero manager involvement, zero coaching burden. Solves most vagueness at the source.
Real-Time Nudge
A report that skipped an optional detail (like the photo) gets a friendly nudge from the shift lead at end of shift: "Next time, grab a quick pic of that panel — helps the shop nail it faster." Not a write-up. A tip.
Weekly Quality Review
If one driver consistently rates low on report quality across a month, a supervisor sits with them for 10 minutes. Not to reprimand — to walk through two of their reports and one from a peer showing what "good" looks like.
Rubber-Stamp Check
A driver reporting zero defects on every shift for a 12-year-old bus is a data pattern that says the inspection is being rushed or skipped. Coaching here is about the inspection walk itself, not the writing.
The whole framework rests on one principle: report quality is a system output, not a driver character trait. When drivers see their reports acted on quickly, when the shop closes the loop with a status back to them, and when the DVIR itself does most of the structuring work, report quality goes up without a single memo. When any of those breaks down, no amount of coaching fixes it. Book a demo to see report-quality scoring per driver alongside the coaching workflow.
What Report Quality Looks Like on a Scorecard
Measuring report quality is the flip side of coaching it. A quality scorecard per driver gives supervisors an at-a-glance view of who is thriving in the workflow and who needs a friendly walkthrough — without any of it being subjective.
The scorecard is not a discipline tool — it is a coaching-targeting tool. Most fleets have three or four drivers who write brilliant defect reports (the shop loves them) and three or four who write vague ones. The scorecard makes the difference visible so coaching goes to the drivers who would benefit, not distributed evenly across everyone.
How BusCMMS Runs Guided DVIR for Better Defect Reports
The features below make the difference between a report a technician can act on and one that requires a phone call. All of it lives inside the standard DVIR flow — no extra step for the driver.
-
Bus-Specific Component Pickers
Stop arms, crossing gates, wheelchair lifts, student mirrors, 8-light systems — every bus-specific system as a first-class picker option.
-
Symptom Taxonomies
Component-specific symptom lists (brakes get squeal/grind/pull; lift gets won't deploy/won't stow/slow) so drivers pick, not type.
-
Photo & Audio Capture
Photo, short video, or audio clip attached directly to the defect record. Timestamp and GPS captured automatically.
-
Context Prompt Cards
"When does it happen?" surfaces after symptom pick, with tap-to-select options (cold start / above 25 mph / every time / intermittent).
-
Report Quality Scorecard
Per-driver rolling-30-day view of overall quality, photo rate, context-fill rate, and shop reopen rate. Targets coaching precisely.
-
Loop-Close Notifications
When a defect the driver reported is repaired, the driver gets a status ping. Reinforces that reports matter and drive real action.
Everything above adds up to a DVIR that respects the driver's time (guided taps beat blank text fields) and gives the shop everything they need to act (structured fields beat guessing). Nobody works harder; the whole system works smarter. The Federal Motor Carrier Safety Administration has long since authorized electronic DVIR under 49 CFR Part 396, so there is no compliance barrier to making the transition.
The Practitioner View: What Structured Prompts Actually Changed
That is the honest before-and-after. Not more drivers trained. Not more discipline. Just a form that walks through the questions a technician would have asked anyway — asked at the moment the driver still has the observation fresh. Sign up free and see the guided DVIR working on your fleet in the first week.
The Bottom Line on Bus Driver Defect Reports
Vague bus driver defect reports are a design problem, not a discipline problem. The DVIR that asks for a sentence gets a sentence; the DVIR that asks structured questions about component, location, symptom, context, and evidence gets structured answers. Everything downstream — technician efficiency, first-time-fix rates, audit trail quality, driver trust in the process — improves once the report itself becomes usable. Coaching still matters, but it targets the 20% the tool cannot solve, not the 80% the tool should have solved from day one. Book a walkthrough to see the full guided DVIR workflow on a bus fleet like yours.
What makes a bus driver defect report actually useful to the shop?
Five fields together: component (which system is affected), location (where on the bus), symptom (what the driver perceived — squeal, grind, pull, etc.), context (when it happens — cold start, above 25 mph, intermittent), and evidence (photo, short video, or audio clip). A report that answers all five gives the technician a diagnostic hypothesis to walk out with. A report that only says "brakes feel weird" forces the technician to find the driver, ask questions, and diagnose from scratch — often after the driver has gone home for the day and the bus sits until morning.
Why do drivers write vague defect reports in the first place?
Usually because the DVIR asks for a sentence and gives them a blank text box. There is no prompt asking where the noise came from, when it happened, or what it sounded like. Drivers are not writing bad reports on purpose — they are writing what the form asked them to write. When the DVIR is a guided flow that walks through component picker, symptom taxonomy, context prompt, and evidence capture, the same drivers produce specific reports without any additional training. The tool teaches by asking the right questions every time.
Does 49 CFR 396.11 require detailed defect descriptions?
No. The federal regulation requires a written report at the end of each work day listing "any defect or deficiency" affecting safe operation or regulatory compliance, plus a certification from the carrier that defects were repaired or repair was not necessary before the vehicle is dispatched again. It does not specify report quality standards. Compliance passes with "brakes feel weird." But operational effectiveness, technician efficiency, first-time-fix rates, and the audit-trail defensibility of the repair chain all depend on report quality far above the regulatory floor. That gap is where a guided digital DVIR pays back.
How should supervisors coach drivers on defect report quality without being punitive?
Four tiers work well. Tier 1 is the DVIR itself — structured prompts fix most vagueness at the source, with zero manager involvement. Tier 2 is a real-time nudge from a shift lead: "Next time grab a quick pic of that panel — helps the shop nail it faster" — framed as a tip, not a write-up. Tier 3 is a weekly quality review with drivers whose 30-day scores sit noticeably below depot average, walking through two of their reports plus a peer's example. Tier 4 targets zero-defect anomalies (a 12-year-old bus reporting zero defects every shift) as an inspection-walk issue, not a writing issue. The whole framework rests on treating report quality as a system output, not a driver character trait.
How does BusCMMS help improve bus driver defect reports?
BusCMMS uses a guided-prompt DVIR flow with bus-specific component pickers (stop arms, crossing gates, wheelchair lifts, student mirrors, 8-light systems as first-class options, not generic truck categories), symptom taxonomies that surface only options relevant to the picked component, context prompts asking when the issue occurs, and integrated photo, video, and audio capture bound to the defect record. Per-driver report quality scorecards show a rolling 30-day view of overall quality, photo rate, context-fill rate, and shop reopen rate — making coaching targeting precise. Loop-close notifications ping drivers when their reported defect is repaired, reinforcing that reports drive real action. All of it lives inside the same platform as work orders, PM, and compliance records.