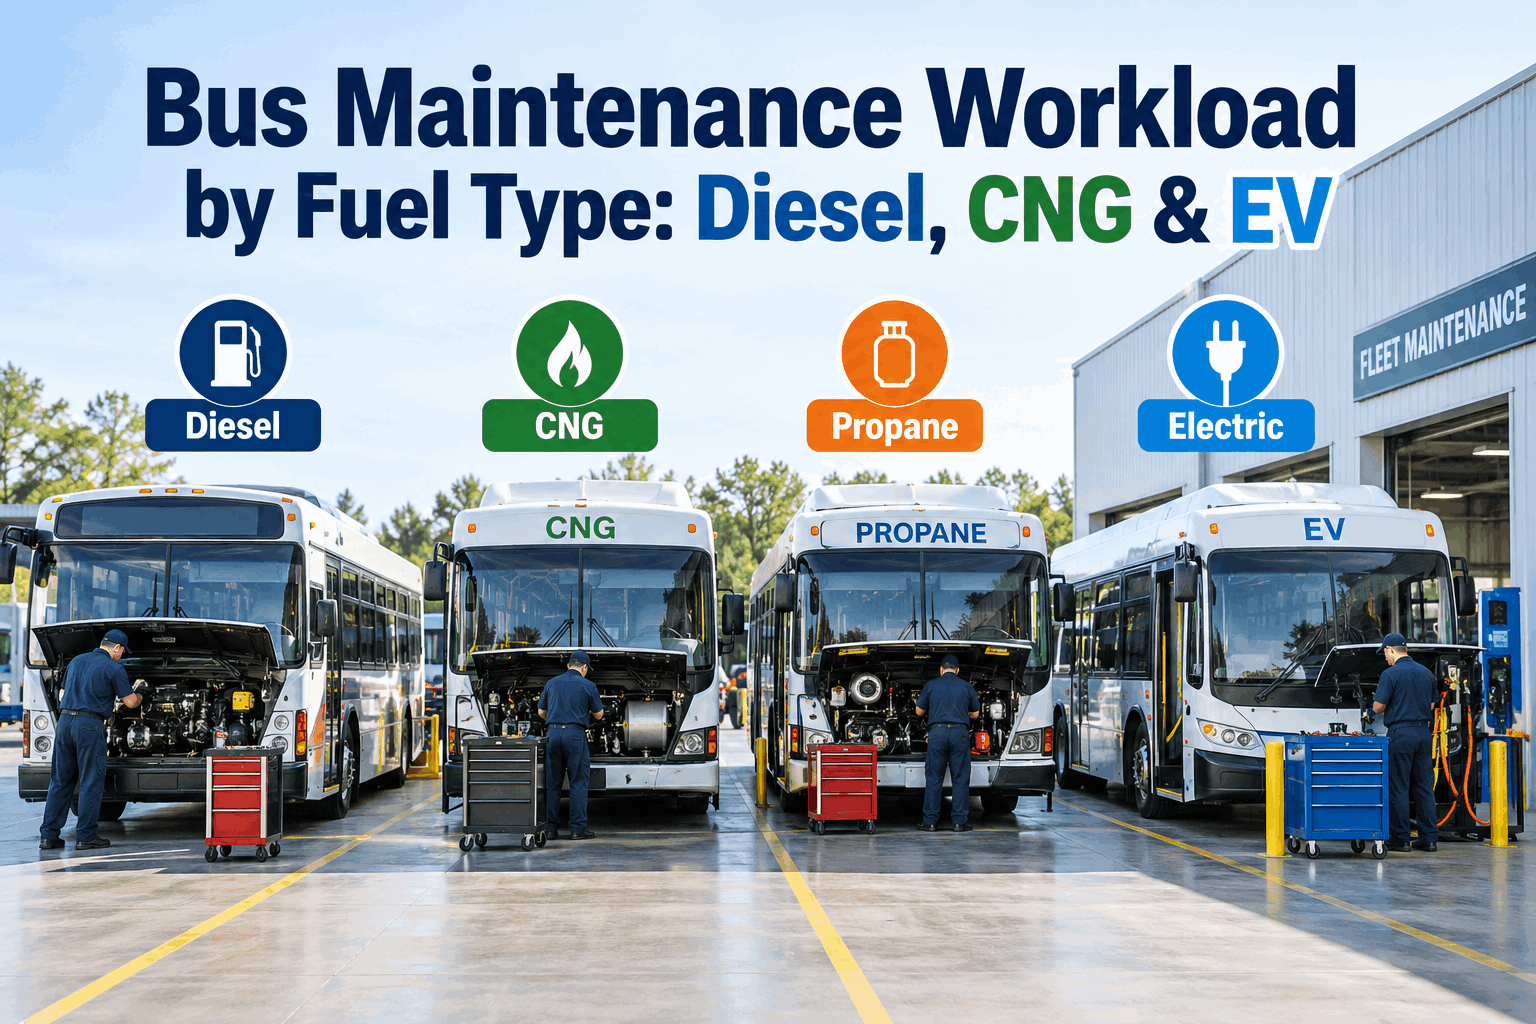
A director asked to compare diesel, CNG, propane and electric maintenance workload on the same page has almost nowhere to go. Every vendor writes for one fuel. This guide puts maintenance workload by fuel type side by side — hours, cost per mile, common failures,and PM cadence — so the fleet-mix decision has real numbers behind it.
Bus Maintenance Workload by Fuel Type: Diesel, CNG & EV
Labor hours, cost per mile, work-order mix and PM cadence — side by side, across diesel, CNG, propane and electric.
Why Directors Get Fuel-Type Workload Wrong
Most fleets do not track maintenance workload by fuel type. They track it by bus. Which means the diesel and CNG hours are averaged together, propane hours (if there are propane units in the mix) get lost in the bus-level total, and electric bus hours — when there are only a few EVs — look like outliers instead of a genuinely different maintenance profile. The result is a director making fleet-mix decisions with the wrong denominators.
The four fuel types genuinely differ. Diesel is the baseline because it is what most fleets have, and its workload is well understood: routine PM, aftertreatment (DPF/DEF/SCR), and the wear items every bus has. CNG runs about a quarter higher labor hours because of cylinder inspection cadence and fuel-system service. Propane sits below diesel because there is no diesel-style aftertreatment. Electric is the lowest total, but the per-visit hours run higher because of the qualified-person safety overhead. Roll those four profiles into one fleet number and every one of them becomes invisible. Book a walkthrough to see labor hours broken down per fuel type on a real fleet.
Annual Labor Hours · The Ring Comparison
Same annual scale, four fuel types, four different ring-fills. The gap between the shortest and longest ring is the fleet-mix decision most agencies never quantify explicitly.
DIESEL
Baseline · conventional wear items plus DPF, DEF and SCR aftertreatment work.
CNG
+27% vs diesel · CGA C-6.4 cylinder inspections and fuel-system labor add real hours.
PROPANE
-13% vs diesel · no diesel aftertreatment; simpler fuel system than CNG.
ELECTRIC
-36% vs diesel total; but +0.5-1.0 hr per work order for HV safety and lockout.
These are directional averages across mid-size U.S. transit and school-bus fleets. Any single agency will see its own numbers pull higher or lower depending on route duty cycle, bus age, and shop practices. The point is not the exact number in the ring — it is the shape of the difference between rings.
Cost Per Mile · Ranked by Fuel Type
Labor hours are half the story. Parts, consumables, and outsourced work make up the other half. Total maintenance cost per mile is where directors and CFOs meet, and it separates the fuel types differently than labor hours alone.
Lowest total. No engine oil, no transmission fluid, no aftertreatment. Traction battery is a long-term capital cost, not a per-mile maintenance line.
Below diesel because no DPF, no DEF, no SCR to service. Popular in Class 3-7 school-bus segment for exactly this reason.
Baseline reference for most fleets. Wide range because aftertreatment reliability varies dramatically by engine platform and duty cycle.
Slightly above diesel on average. Cylinder inspection cadence and higher-cost fuel-system parts push maintenance CPM up despite the cheaper fuel itself.
Two things worth flagging. First, CNG frequently costs more to maintain than diesel — a fact that surprises fleets that switched to CNG expecting an all-around cost reduction. The savings are on fuel spend, not maintenance spend. Second, electric shows a wide range because early-generation EVs and Gen I hybrid architectures had substantially higher maintenance cost per mile than newer platforms. NREL's NYCT study found Gen II hybrid maintenance cost per mile ran 39% below Gen I. Fleet age matters as much as the fuel-type label. Sign up free and pull the first cost-per-mile roll-up by fuel type this week.
Where the Work Orders Actually Land
Aggregate hours and cost tell one story; the mix of work orders tells another. Each fuel type concentrates its work in different categories. This is what separates a diesel shop calendar from a CNG shop calendar from an EV shop calendar — even at similar total hours.
Look at brakes: 20% of diesel work orders, 18% CNG, 24% propane, but only 18% electric — and even that 18% is inflated by pad and rotor cleaning; actual replacement frequency drops roughly 60-80% on electric because of regenerative braking taking most of the wear. Then look at the top row: what used to be "engine & aftertreatment" on diesel becomes "fuel system & cylinders" on CNG, "engine" on propane, and "HV drive & battery" on electric. Same top slot, four completely different technician skill sets required to work it.
Failure Signatures · What Each Fuel Type Actually Breaks
Every fuel type has a signature failure profile — the specific things that go wrong more often than anything else, and that a specialist for that fuel type learns to look for first. These are the top-of-mind failures shops see across each fuel category.
- DPF clogging & forced regen failures
- DEF injector faults & SCR catalyst degradation
- Turbocharger wear
- EGR valve carbon buildup
- Fuel injector wear (high-mileage)
- Cylinder inspection findings (surface damage)
- High-pressure fuel line leaks
- Fuel filter clogging
- Regulator wear & leak-by
- Spark plug fouling on Cummins Westport engines
- Fuel lock & vaporizer icing (cold weather)
- Fuel filter changes on high-mileage units
- Injector cleaning
- Coolant system service (regulator uses coolant)
- Spark plug replacement
- Charging interface / connector damage
- HVAC system (biggest energy draw)
- Air compressor for brakes / doors
- Traction motor bearing service
- Battery thermal management (coolant loop)
Two counter-intuitive notes. On electric, HVAC is the number-two failure category not because HVAC hardware is fragile but because it is the biggest energy draw on the bus — when the HVAC fights the battery for range on hot days, faults show up. And on propane, cold-weather fuel-lock and vaporizer icing dominate cold-climate fleets in a way that never appears on diesel or CNG. Book a walkthrough to see failure-signature analytics filtered by fuel type.
The NREL NYCT Study: Real Numbers From a Real Comparison
NREL × New York City Transit
In-use performance comparison of diesel, CNG and hybrid-electric transit buses
The National Renewable Energy Laboratory evaluated diesel, CNG and hybrid-electric transit buses at NYCT, comparing propulsion-related and total maintenance cost per mile across service years. Two findings stand out for any director thinking about fleet-mix workload.
Gen II vs Gen I Hybrid
Gen II hybrid maintenance cost per mile ran 39% below Gen I hybrid. Fleet-generation matters as much as fuel-type label — early-adopter workload does not predict mature-platform workload.
CNG vs Gen I Hybrid
CNG maintenance cost per mile ran 5% above Gen I hybrid on total; propulsion-only, CNG ran roughly 5% below. The gap between those two figures is where CNG cylinder-inspection overhead shows up.
PM Cadence: Each Fuel Runs on a Different Calendar
The interval logic is not the same across fuel types. Mileage triggers dominate for some, calendar triggers dominate for others, and a few PMs are event-triggered by inspection findings. Getting the cadence right per fuel type is the difference between a smoothly-flowing PM calendar and a lumpy one that leaves the shop overloaded some weeks and idle others.
The electric row is the one most agencies model wrong. Because EVs accumulate mileage slowly on local routes, mileage-based PM triggers rarely fire — and if the PM calendar was inherited from the diesel side, EV PMs get missed. Electric buses need calendar-based PM triggers with the mileage trigger as a backup, not the other way around. Getting that switch wrong turns a lower-workload fuel type into a compliance problem.
How BusCMMS Analytics Answer Fuel-Type Workload Questions
Every one of the numbers in this guide can be pulled from a fleet's own work-order history — if the CMMS tags each bus by fuel type and rolls up the data that way. That is the entire point of running fuel-type analytics.
-
01
Fuel-Type-Filtered Workload
Every work order tagged by bus fuel type. Roll up hours, dollars, and count by any window — monthly, quarterly, per bus, per shop.
-
02
Cost Per Mile by Fuel
Auto-calculated CPM per fuel type using labor + parts + outsourced spend divided by miles driven. Refresh monthly.
-
03
Category Breakdown
Work-order distribution by category (engine, brakes, HVAC, fuel-system, etc.) per fuel type. Spot the signature failures early.
-
04
Generation Cohorts
Group buses by model year within fuel type so early-generation and current-generation workload profiles stay separated in the reporting.
-
05
Calendar vs Mileage PM Logic
Configure PM cadence per fuel type independently — diesel mileage-dominant, EV calendar-dominant, CNG with 3-year cylinder overlay.
-
06
Board-Ready Comparison Reports
One-click export of side-by-side fuel-type workload tables for fleet-composition decisions. Replaces the manual spreadsheet.
The Bottom Line on Maintenance Workload by Fuel Type
Diesel, CNG, propane and electric are four distinct maintenance workload profiles, not variants of one. Directors making fleet-mix decisions with fleet-wide averages are working from the wrong numbers. Tag every bus by fuel type, roll up work-order hours and cost per mile inside those tags, break the categories out, and separate generations within each fuel. That is the difference between a fleet-mix strategy that gets validated by the shop three years later and one that gets contradicted by it. Sign up free and see your first fuel-type workload breakdown within a week.