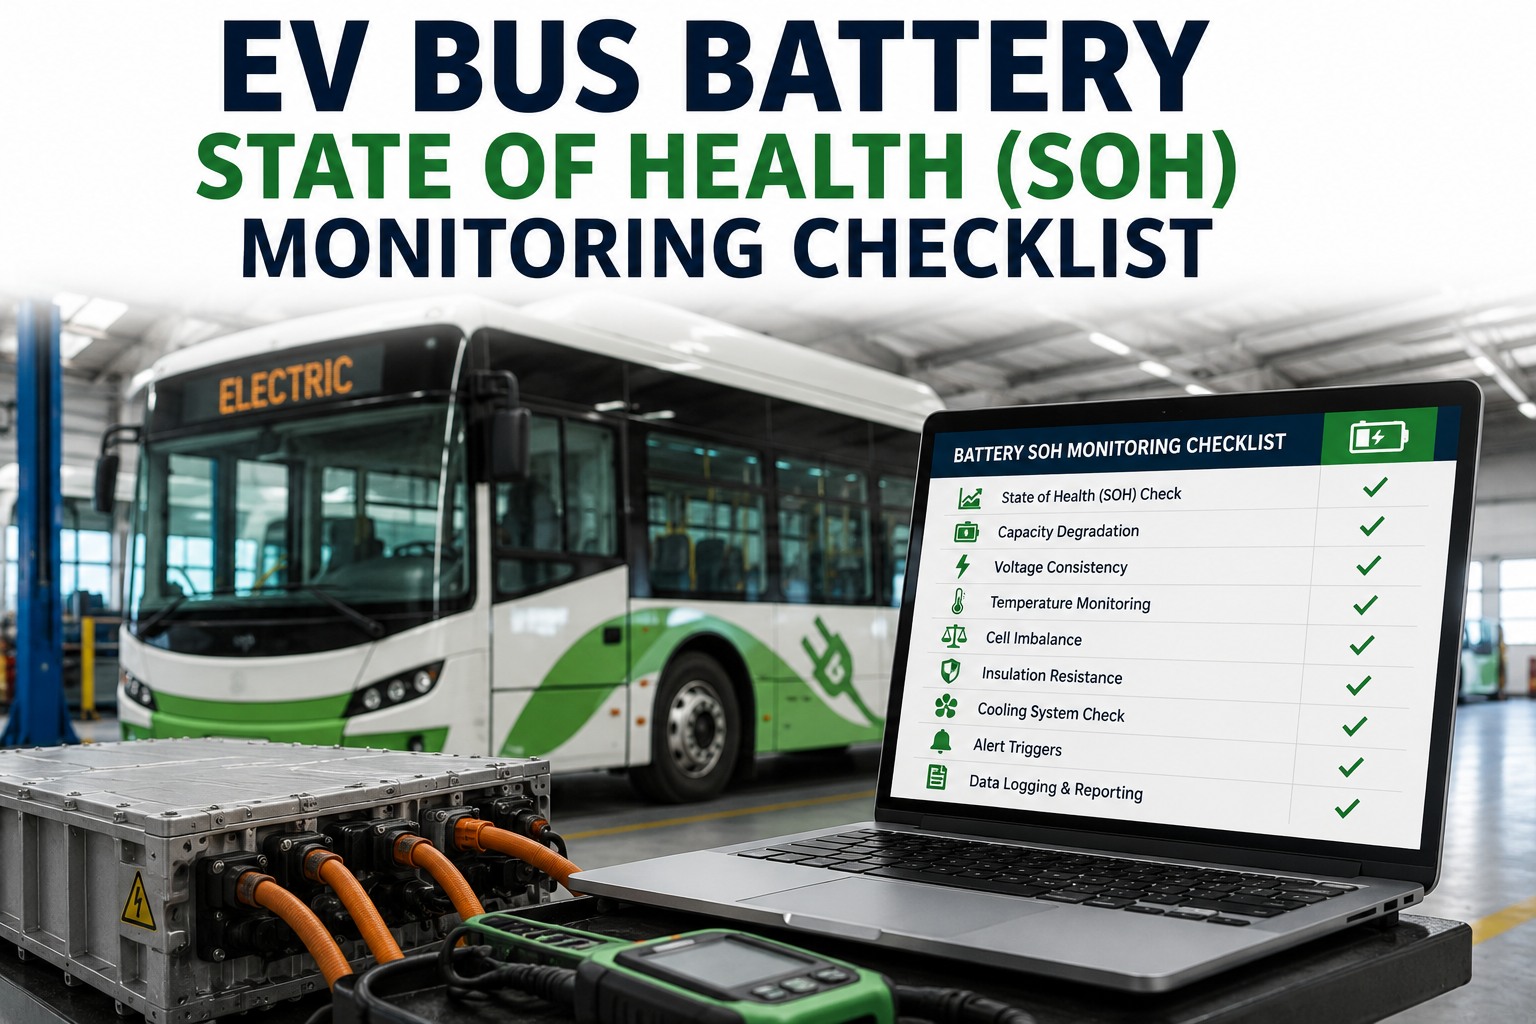
Bus #47 rolled out this morning showing 84% SOH on the BMS display. Last quarter it was 89%. Nobody flagged the 5-point drop because nobody was tracking the trend -- just the last reading. That is how a $120,000 battery pack quietly slides toward the warranty threshold while you focus on daily pull-outs. An EV bus battery State of Health monitoring checklist is not a nice-to-have. It is the difference between catching degradation while the OEM still owns it and paying for it yourself.
EV Bus Battery State of Health (SOH) Monitoring Checklist
The daily, monthly, and quarterly battery checks that protect warranty coverage, extend pack life, and keep your electric buses on route.
- BMS data capture
- Thermal + charging trends
- Warranty-ready records
What SOH Actually Measures (and Why the Number Matters)
In the diesel world, engine health lives in oil samples, compression readings, and blowby measurements. In the EV world, one number carries most of the weight: State of Health. It answers a simple question -- how much usable capacity is left compared to the day the pack was installed.
- 100%New pack, day one
- 80%Transit end-of-life threshold
- 70%Typical OEM warranty floor
Most OEM battery warranties guarantee capacity to 70% over 8-12 years. Below that, the pack is considered spent for transit duty -- range collapses and route reliability breaks down. The catch: the SOH your BMS displays on-screen is a snapshot, not a trend. Miss the trend and you miss the warranty window. Book a demo to see live SOH trending across your EV fleet.
The Complete SOH Monitoring Checklist, by Interval
Here is what should happen at each interval to keep a bus battery pack on trend. Every item ties back to either warranty defensibility, thermal stress prevention, or early-catch of an accelerating degradation curve. Sign up free and load this as an auto-triggered PM template.
-
Daily Pre-Pullout Battery Checks
Every driving shift · ~3 min
- Pack temperature at pull-out (log actual value)
- State of Charge target: 85-95% at pull-out
- BMS fault code scan (clear = go)
- Cell voltage delta within OEM spec
- Thermal system audible / visual check
-
Weekly Charging & HV Trend Review
Once per week · ~15 min per bus
- Charging session count + DC fast events
- Deep discharge events (below 10% SOC)
- HV cable + orange connector visual
- Coolant level + no leak signs
- Charger EVSE dispenser inspection
-
Monthly SOH + Efficiency Snapshot
Once per month · ~30 min per bus
- BMS SOH reading logged to per-bus record
- kWh per mile trend vs baseline
- Ambient temperature exposure log
- Battery pack external visual inspection
- Charging efficiency percentage review
-
Quarterly Deep Diagnostic + Safety
Every 3 months · ~2 hr per bus
- Full SOH trend chart vs baseline & fleet average
- Cell-to-cell degradation variance review
- HV insulation resistance test
- Thermal management system service
- BMS firmware update check
-
Annual Warranty-Grade Capacity Test
Once per year · documented
- Formal SOH capacity test per OEM procedure
- SOH result vs warranty threshold documented
- End-of-life projection updated
- OEM report submission (if required)
- Second-life or replacement plan updated
The 3 Life Stages of a Bus Battery Pack
Not every bus battery ages the same way, but every pack passes through the same three stages. Knowing which one each bus is in tells you what to focus on and when to start planning capital replacement. Book a demo to see per-bus lifecycle stage tracking on a live dashboard.
-
01 Early Life Optimize Phase
Years 0-3 · 92-100% SOH
Focus: lock in good charging habits, avoid DC fast overuse, keep pack in the 15-35 degree Celsius window.
-
02 Mid Life Monitor Phase
Years 3-6 · 80-92% SOH
Focus: track SOH trend per bus, match slower packs to shorter routes, catch cell-variance outliers.
-
03 Late Life Transition Phase
Years 6-12+ · below 80% SOH
Focus: file warranty claim before threshold, plan capital replacement or second-life energy-storage sale.
What Actually Accelerates Bus Battery Degradation
A 2025 Geotab study of 22,700 EVs found that charging strategy alone creates a 12-point SOH difference after eight years. Fleets doing everything else the same still finish the decade with wildly different pack conditions. Here are the top four factors, ranked by SOH impact.
-
01Highest impact
Heavy DC Fast Charging
Each session raises pack temp 10-15 degrees Celsius, stressing cells with every cycle.
-
02High impact
Charging to 100% Habitually
Full-charge sits at high voltage. Target 85-90% for daily service and reserve 100% for long routes.
-
03High impact
Sustained Heat Exposure
Pack temps above 35 degrees Celsius accelerate capacity loss 15-25% over time. Above 60 = risk of electrolyte breakdown.
-
04Moderate impact
Frequent Deep Discharge
Repeatedly running below 10% SOC stresses low-voltage cells and speeds capacity loss.
The takeaway: fleets that log charging behavior alongside SOH readings can spot which buses are on a degradation curve years before the warranty threshold. Book a demo to see charging-and-SOH correlation reports across your fleet.
How BusCMMS Automates the SOH Checklist
A checklist on a PDF gets photocopied and forgotten. A checklist that pulls BMS data, logs SOH per bus, and fires the right work order at the right interval -- that is a program that actually protects the pack.
-
01
BMS Data Sync
SOH, SOC, and cell voltage pulled directly from telematics. No manual entry.
-
02
SOH Trend Charts
Per-bus SOH plotted vs baseline and fleet average. Outliers surface early.
-
03
Charging Behavior Log
DC fast events, deep discharges, and idle charge time captured per session.
-
04
Thermal Event Alerts
Pack temperature outside 15-35 degree window triggers an alert and log entry.
-
05
Warranty File Export
Complete SOH history exports for OEM claims in one PDF, per pack.
-
06
HV-Certified Tech Routing
Battery and HV work only goes to certified technicians. Cert expiry tracked.
Fleets using structured SOH monitoring show approximately 7.2% capacity loss after five years -- versus 12-18% for fleets running unmanaged charging and thermal exposure. Over a 50-bus fleet, that is millions of dollars in preserved pack value. Book a demo to see the BMS integration on your actual bus model.
What Fleet Managers Say About SOH Tracking
We were writing SOH numbers on a clipboard once a month. When we finally trended them per bus in BusCMMS, three of our 22 buses were dropping twice as fast as the rest. Two turned out to be a coolant flow issue we would have missed until the OEM warranty ran out.
The warranty claim was won or lost in the records. Our OEM asked for 18 months of charging and thermal history in an audit. Being able to hand over a complete, timestamped PDF export -- one bus at a time -- is what kept a $95K pack replacement on their side of the invoice.
What is a good State of Health (SOH) for an electric bus battery?
A new battery pack starts at 100% SOH. For transit and school bus service, 92-100% is considered healthy, 80-91% is watch-mode where wear rate needs tracking, and below 80% is generally treated as end-of-life for revenue duty because range loss makes route reliability difficult. Most OEM warranties guarantee capacity to 70% over 8-12 years, which is the point at which the pack qualifies for warranty replacement. Buses following optimized charging and thermal management protocols show only about 7.2% capacity loss after five years.
How often should EV bus battery SOH be checked?
A complete SOH monitoring program combines five intervals. Daily: pack temperature at pull-out, BMS fault code scan, cell voltage delta. Weekly: charging session count, DC fast events, deep discharge log. Monthly: SOH reading logged per bus, kWh per mile trend, ambient temperature exposure. Quarterly: full SOH trend chart vs baseline, cell variance review, HV insulation resistance test, thermal system service. Annual: warranty-grade capacity test with formal documentation. Whichever interval hits first triggers the checklist item.
What accelerates bus battery degradation the most?
Charging strategy has the largest single impact. A 2025 Geotab study of 22,700 EVs found charging habits alone create a 12-point SOH difference after eight years. The top four accelerators, in order, are: heavy DC fast charging (each session raises pack temperature 10-15 degrees Celsius), charging to 100% habitually instead of 85-90%, sustained heat exposure above 35 degrees Celsius (15-25% faster capacity loss), and frequent deep discharge below 10% SOC. All four are trackable in a CMMS and preventable with better charging protocols.
Why is SOH trending more important than a single BMS reading?
The SOH your BMS displays is a snapshot -- a single number at one moment. Battery capacity has natural fluctuation from temperature, state of charge, and cell balancing, so any single reading can look better or worse than reality. Trending SOH monthly across a full year reveals the actual degradation curve for each bus, which is what warranty claims depend on and what tells you which buses are aging abnormally. Without a trend, a pack can slide toward the 70% warranty threshold without anyone noticing -- until the OEM window closes.
How does a bus CMMS help protect battery warranty claims?
A bus-specific CMMS pulls SOH, SOC, cell voltage, and pack temperature directly from telematics, logs the values per bus at each PM interval, and stores charging session data including DC fast events and deep discharges. When SOH approaches the warranty threshold, the CMMS produces a timestamped PDF export documenting the pack's complete service history -- exactly the record an OEM will request during a warranty claim. Fleets that maintain this documentation win warranty replacements worth $80,000 to $150,000 per pack. Fleets that cannot produce it typically pay out-of-pocket.







