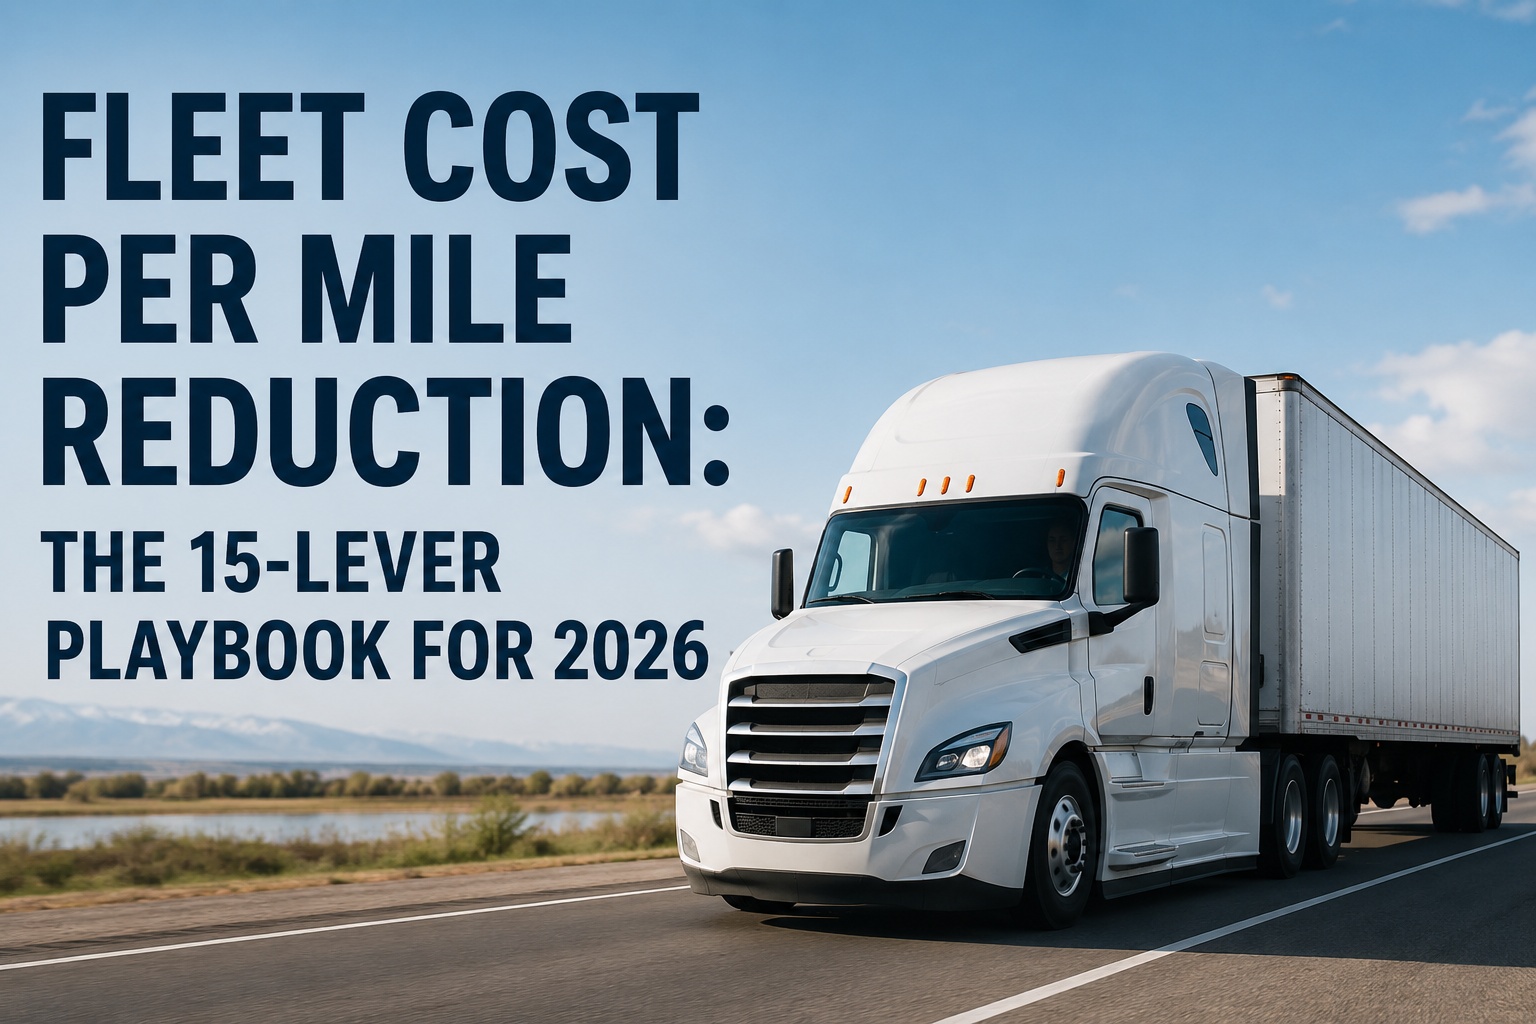
ATRI's 2026 Analysis of the Operational Costs of Trucking put the average U.S. fleet's cost-per-mile at $2.336 -- the highest per-mile figure ever recorded, up 3.4% from 2024. Repair and maintenance jumped 8.6%. Insurance is at a record $0.102 per mile as nuclear verdicts climbed 52% to a $51 million median. This is the 2026 15-lever playbook -- grouped by maintenance, fuel, tires, utilization, and risk -- that operational leaders are actually using to pull their CPM back down. See BusCMMS track cost-per-mile per bus with category breakdowns → book a 20-min demo.
Fleet Cost Per Mile Reduction Playbook
The 15 levers that operational leaders are actually pulling to move their CPM in 2026, grouped by category with real dollar impact per lever.
Where Every $2.336 Actually Goes
The 5 cost categories that add up to your CPM. Attack the biggest ones first.
Cost-per-mile is the sum of five variable categories plus fixed overhead. ATRI's 2026 report shows every major category rose in 2025 -- but the concentration is not even. Nearly half of every CPM dollar goes to driver wages and benefits, which crossed $1.00/mile for the first time in industry history. The next three categories -- fuel, equipment payments, and repair/maintenance -- combined equal roughly another 40 cents on the dollar. Insurance, tires, tolls, and permits fill in the rest.
Driver Wages & Benefits
First time above $1/mile. Benefits alone rose meaningfully in 2025 as fleets competed for a shrinking driver pool.
Fuel
Highly variable. Diesel volatility, idle time, and driver behavior swing this number by 15-25% between fleets on identical equipment.
Equipment Payments
Truck and trailer payments jumped 8.3% in 2024 and continued climbing. Fixed cost -- what varies is how many miles it spreads across.
Repair & Maintenance
Up 8.6% in 2025 -- the biggest single-year jump. Aging fleets and unscheduled repairs drive most of the increase.
Insurance, Tires, Tolls, Permits
Insurance alone hit $0.102/mile as nuclear verdicts pushed premiums. Tires and tolls posted the largest percentage increases in 2025.
Any serious cost-reduction plan attacks driver, fuel, and maintenance first -- roughly 72% of CPM sits in those three buckets. See BusCMMS break CPM into category-level trends per bus → book a demo.
The 15-Lever Playbook, Grouped by Category
Every lever below is measurable, has documented industry ROI, and can be implemented without capital expenditure.
The biggest controllable category. Attack this first.
- 01
PM Compliance at 95%+
Move buses from run-to-failure to scheduled PM. Unscheduled repairs cost 3-5x scheduled work.
-8 to -15% CPM - 02
Predictive Maintenance
Trend oil analysis, vibration, DVIR patterns to catch failures 30-90 days early. Every catch avoids emergency labor rates.
-4 to -10% CPM - 03
Warranty Capture
Most fleets miss 30-40% of eligible warranty claims because they cannot document the maintenance history required.
-3 to -8% CPM - 04
Extended-Drain Programs
Use fluid analysis to safely extend oil, transmission, and coolant intervals with lab data as justification.
-2 to -5% CPM
Highest volatility. Easiest wins with driver behavior.
- 05
Idle Time Reduction
Every hour of idle burns roughly a gallon. Target below 15% idle time. Delivers 5-10% MPG gain across the fleet.
-5 to -10% Fuel - 06
Driver Behavior Scoring
Smooth acceleration, steady speeds, anticipatory braking. Same trip in the same truck can vary 15-25% by driver technique.
-4 to -8% Fuel - 07
Route Optimization
Cut deadhead miles, reduce backtracking, sequence stops for total distance minimization. Compounds with fuel and time savings.
-3 to -7% Fuel - 08
Fuel Card Reconciliation
Match every fill-up to a specific bus and driver. Detect fraudulent purchases, personal fills, and MPG anomalies within days.
-1 to -3% Fuel
Fast-rising category. Discipline matters more than product choice.
- 09
Tire Pressure Monitoring
Every 10 PSI under-inflation costs roughly 1% MPG. Automatic TPMS or scheduled pressure checks pay for themselves inside 6 months.
-3% MPG per 10 PSI - 10
Retread Program
Casings retreaded 2-3 times cut tire cost per mile 40-50%. Requires disciplined casing tracking and pull-point rules.
-40 to -50% Tire - 11
Rotation & Alignment Discipline
Rotation every 15,000-25,000 miles and alignment on any pull complaint. Extends tire life 15-25% at near-zero incremental cost.
+15 to +25% Life
Miles per truck dropped from 105K to 86K since 2016. Fixed costs spread thinner.
- 12
Deadhead & Dwell Reduction
Truckload drivers average 1.71 hours dwell per stop. Every hour cut is a revenue mile gained. Attack dispatcher assignment and load matching.
+10 to +20% Miles - 13
Cut Unseated Trucks
Industry average: 10% of trucks sitting without a driver. Every unseated truck is 100% fixed cost with zero revenue miles.
-5 to -10% Fixed CPM
Insurance at record $0.102/mile. Nuclear verdicts up 52%.
- 14
DVIR Compliance & CSA Score
Complete, timestamped pre/post trip inspections cut vehicle maintenance CSA percentile. Better percentile means lower premiums at renewal.
-10 to -20% Premium - 15
Driver Safety Programs
Documented safety training + coaching from driver behavior data. Insurers reward this at renewal. Also cuts the accident frequency that triggers nuclear-verdict exposure.
-5 to -15% Premium
The math is remarkable. Even hitting the low end of each category compounds to a 20-30% CPM reduction across a mixed fleet. See BusCMMS enable 8 of these 15 levers on one platform → book a demo.
The Math: What 15 Levers Actually Save
Worked example on a 50-bus fleet averaging 25,000 miles per bus per year.
This is the model to show the CFO. A 50-bus school district or transit operation averaging 25,000 miles per bus per year runs 1.25 million total miles annually. At an ATRI-style CPM of $1.80 (bus fleets typically run below the trucking average because miles-per-year is lower and duty cycle is different), the annual maintenance budget is $2.25 million. Even modest movement on the levers above pulls big dollars back to the operating margin.
$750,000 in annual savings on a 50-bus fleet is the difference between "we barely broke even" and a healthy operating margin. That is the actual reason the CFO in your board meeting cares about CPM tracking discipline. Every one of the 15 levers above is measurable. Every dollar traced back to a specific bus, a specific driver, a specific work order.
$750K on a 50-bus fleet is not theoretical -- it is what per-bus, per-category CPM tracking delivers. See BusCMMS run this model on your fleet → book a demo.
Why Most Fleets Cannot Actually Pull These Levers
The gap between knowing the levers exist and actually moving them is where most fleets get stuck.
No CPM Per Bus
Fleet-average CPM hides the 2-3 buses running at $2.80/mi that are dragging the whole number up. Without per-bus CPM, you cannot see the outliers to fix or replace.
No Category Breakdown
Accounting shows "maintenance spend." It does not show labor vs parts vs unscheduled repair vs warranty deductibles. Without category breakdown, you cannot attack the specific lever that has room to move.
Monthly Reporting Lag
Numbers arrive 30-45 days after the month closes. By the time the CFO sees the CPM drift, the operational cause is already 60 days in the past.
Spreadsheet Fatigue
Manual tracking works for the first 6 months. Then someone forgets a column, another shop uses a different template, and the analysis quietly stops. Discipline requires system, not spreadsheets.
The 15 levers only exist for fleets that measure them monthly, per bus, in categories. Sign up free and start tracking CPM per bus in categories →
Where BusCMMS Fits Your CPM Reduction Program
Eight of the 15 levers live on one platform. Six more integrate through open APIs.
CPM Per Bus, Per Category
Auto-calculated cost per mile for each bus, broken into labor, parts, unscheduled repair, tires, fluids. Refreshed monthly.
PM Compliance Dashboard
Real-time percentage of PMs completed on schedule per bus, per shop, per technician. Lever 1 delivered.
Predictive Maintenance Signals
Oil analysis integration, DVIR pattern detection, and fault code trend alerts. Lever 2 delivered.
Warranty Period Tracking
Every component's warranty window per bus. Pre-expiration alerts to capture eligible claims. Lever 3 delivered.
Tire Life & Rotation Log
Retread tracking, rotation scheduling, and pressure logs per position per bus. Levers 9-11 delivered.
DVIR Compliance + CSA Reporting
Digital DVIRs with driver + inspector + shop signatures. CSA-ready reports for insurance renewal. Lever 14 delivered.
We were at $1.87 per mile in fiscal 2023. Board thought it was fine because nobody had a benchmark. Two things turned it around. First, we started tracking CPM per bus monthly instead of fleet-average annually -- turned out three buses were pulling the whole fleet average up. Second, we split the number into labor, parts, unscheduled repair, tires, and fluids. Suddenly the conversation stopped being "we spent a lot" and started being "unscheduled repair is 28% of maintenance spend, PM compliance is 62%, here is the specific plan to get PM to 90% next quarter." Twelve months later we were at $1.19. Same fleet, same routes, same drivers. Different measurement.
Fleet-average CPM hides the outliers. Per-bus CPM reveals them. See the difference live →
Frequently Asked Questions
What is the average fleet cost per mile in 2026?
According to ATRI's 2026 Analysis of the Operational Costs of Trucking (released July 2026 covering 2025 data), the industry-average cost to operate a truck was $2.336 per mile -- the highest per-mile figure ever recorded, up 3.4% year-over-year. Excluding fuel, operating costs rose 4.2% to $1.854 per mile. Driver wages and benefits crossed $1.00 per mile for the first time in industry history. Fuel averaged $0.482 per mile. Repair and maintenance saw the largest single-year jump at 8.6%. Insurance reached a record $0.102 per mile as nuclear verdicts climbed 52% with a $51 million median award. Bus and school district fleets typically run below the trucking average -- roughly $1.20 to $1.80 per mile depending on fleet type -- because bus fleets have lower annual mileage per vehicle and different duty cycles, but the same category dynamics apply.
What are the biggest levers for reducing fleet cost per mile?
Fifteen measurable levers deliver documented ROI, grouped into five categories. Maintenance offers the four highest-impact levers: PM compliance at 95%+ (which cuts unscheduled repairs that cost 3-5x scheduled work) delivers 8-15% CPM reduction; predictive maintenance using oil analysis and DVIR pattern trending catches failures 30-90 days early; warranty capture recovers 30-40% of missed eligible claims; and extended-drain programs use fluid analysis to safely stretch service intervals. Fuel offers four more levers: idle reduction (below 15% target), driver behavior scoring, route optimization, and fuel card reconciliation -- together delivering 10-20% fuel savings. Tires deliver 15-30% through pressure monitoring (every 10 PSI under-inflation costs 1% MPG), retread programs (40-50% tire CPM reduction), and rotation discipline. Utilization adds levers on deadhead/dwell reduction and cutting unseated trucks (industry average is 10%). Risk levers on DVIR compliance/CSA scoring and driver safety programs cut insurance premiums 10-25% at renewal. Combined, these deliver 20-30% total CPM reduction on typical fleets running above the median.
How much can a fleet actually save by reducing cost per mile?
The math scales with fleet size. On a 50-bus fleet averaging 25,000 miles per bus per year (1.25 million total annual miles), a CPM reduction from $1.80 to $1.20 saves $750,000 annually -- the difference between a healthy operating margin and barely breaking even. The reduction typically comes in phases: pulling the four maintenance levers first (PM compliance, predictive maintenance, warranty capture, extended-drain) delivers roughly 15% CPM reduction in the first 6-12 months. Adding fuel and tire levers pushes to 20-25% by month 12-18. Utilization and risk levers deliver the last 5-10% in year 2. On a 100-bus fleet running 2.5 million miles annually, the same trajectory saves $1.5 million per year. On a 25-bus fleet at 625,000 miles, roughly $375,000 per year. Every fleet trajectory depends on where the baseline CPM sits -- fleets already at the industry median have less room to move than fleets running above the 75th percentile.
Why do most fleets fail to reduce cost per mile despite knowing the levers?
Four measurement gaps stop most cost-reduction programs. First, no per-bus CPM -- fleet-average CPM hides the two or three outlier buses running at $2.50/mile that drag the whole number up, so operators cannot see which specific buses to fix or replace. Second, no category breakdown -- accounting shows total maintenance spend but does not split labor, parts, unscheduled repair, tires, and fluids, so operators cannot identify which specific lever has room to move. Third, monthly reporting lag -- numbers arrive 30-45 days after month close, so by the time the drift is visible, the operational cause is 60 days in the past and hard to correct. Fourth, spreadsheet fatigue -- manual tracking works for 6 months, then someone forgets a column, another shop uses a different template, and analysis quietly stops. All four gaps are solved by moving CPM tracking off spreadsheets and into a purpose-built CMMS that auto-calculates per-bus, per-category CPM and refreshes monthly without manual data entry.
How does BusCMMS help reduce fleet cost per mile?
BusCMMS auto-calculates cost per mile per bus, per route type, and per fuel type -- refreshed monthly with data pulled from work orders, parts issues, and telematics odometer readings. Category-level breakdowns show labor, parts, unscheduled repairs, tires, and fluid costs over 12-month trends so the specific lever with room to move surfaces immediately. Eight of the fifteen levers ship on the platform natively: PM compliance dashboard tracking completion rate per bus and technician, predictive maintenance signals from oil analysis and DVIR pattern detection, warranty period tracking with pre-expiration alerts, tire life and rotation logs per position per bus, DVIR compliance with CSA-ready reports for insurance renewal, and category-level CPM analytics for the board. Six more levers integrate through open APIs to telematics, fuel cards, and dispatch systems. One 68-bus Southwest transit agency reported moving from $1.87 to $1.19 CPM within twelve months after switching from fleet-average annual tracking to BusCMMS per-bus monthly category tracking -- same fleet, same routes, same drivers, different measurement discipline.