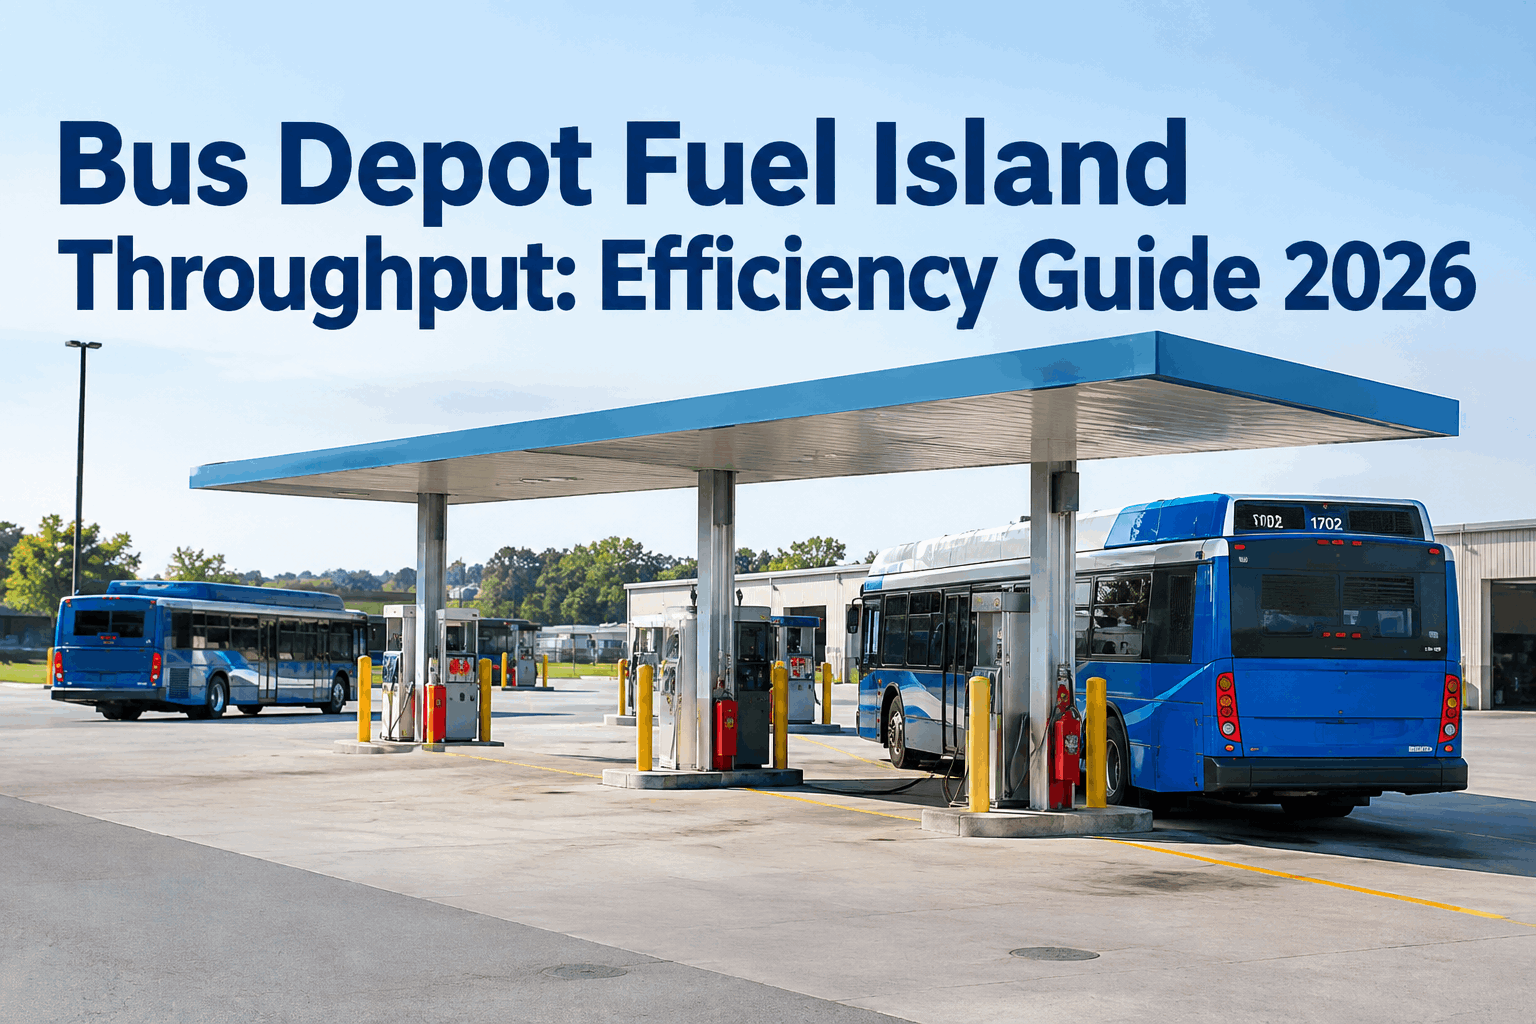
Every depot manager knows the shape of the afternoon. Between 2:30 and 5:00 pm, buses roll in from their last routes and every one of them needs to fuel, DVIR, and park before the driver goes off the clock. The fuel island either handles that surge or it does not, and the difference is measured in overtime hours, delayed yard prep, and next-morning pull-outs that start behind. This guide covers bus depot fuel island throughput the way an operations manager runs it — the cycle math, the real bottlenecks, and the levers that move buses per hour without pouring concrete for a second island.
Bus Depot Fuel Island Throughput: The Post-Route Surge Playbook
Cycle-time math, the five real bottlenecks, layout economics, and the levers that move buses-per-hour without adding a lane.
- 3-6 minTypical cycle
- 5Real bottlenecks
- 2-3 hrSurge window
Why Fuel Island Throughput Is a Real Operations Problem
A fuel island that clears 12 buses per hour looks fine on paper. But bus arrivals do not distribute evenly across the day — they arrive in a compressed surge between the end of afternoon routes and shift change. A depot with 64 buses on afternoon routes might see 45 of them return within a 90-minute window. If the island can handle 12 per hour, the last bus through waits over an hour behind idling diesels for a job that takes six minutes at the pump. That queue is where fuel island throughput becomes a real operating cost.
Every 30 seconds shaved off the average fuel cycle recovers roughly one extra bus per hour per lane. On a 2-lane island running a 2.5-hour surge, that is 5 additional buses cleared before shift change — the difference between everyone going home on time and the last three drivers logging overtime every night.
The cost stacking is quiet but consistent. Overtime for drivers waiting to complete post-trip. Idling fuel burn while queued. Yard prep and next-morning pull-out planning that starts an hour late. And on the safety side, a rushed fueler making transaction entry errors under queue pressure — wrong bus IDs, skipped odometer captures, missed fuel-card auth — that then contaminate the whole month's fuel data. Book a walkthrough to see cycle-time tracking pulled straight from dispensing timestamps.
The Anatomy of a Fuel Cycle
Every bus that passes through the island runs the same five-step sequence. Timing each step separately is the first honest measurement most depots ever take — and it almost always surprises whoever runs the number, because dispensing itself is rarely the longest step.
- Position & align~30 sec · approach, park, exit cab
- Post-trip DVIR start~25 sec · walk-around, quick check
- Transaction entry~50 sec · bus ID, odometer, driver
- Dispense fuel~80 sec · 30-40 gal at 20-25 GPM
- Depart to parking~15 sec · cap on, pull forward
Notice where the time actually lives. Dispensing is the largest single chunk (as it should be — that is the work), but transaction entry runs a close second and is fully controllable. Manual bus-ID entry, hand-written odometer capture, and post-hoc data reconciliation stretch that 50-second step to 90 seconds fast under queue pressure. The five-step breakdown is the map for finding your actual bottleneck rather than guessing that "the pumps are slow."
The Throughput Math (And What Your Real Ceiling Is)
Fuel island throughput comes down to one equation with three variables. Get the equation and you can predict — not guess — exactly how many buses your island can clear in a given surge window, and whether adding a lane, upgrading a pump, or speeding up the transaction is the higher-leverage move.
The scenarios above illustrate why cycle time is the single most leveraged variable. Going from a 5-minute cycle to a 3.5-minute cycle on the same two lanes with the same pumps adds 10 buses per hour of capacity — enough that a 45-bus post-route surge finishes in 65 minutes instead of 112. And it requires no new equipment, no new lanes, no new fuelers. It requires the transaction step to stop being manual. Sign up free and time your first ten cycles to see where your real minutes are hiding.
The 5 Real Bottlenecks (Ranked by How Often They Are the Cause)
When throughput is bad, most depot managers blame the pump. Sometimes that is right; usually it is not. Here are the five bottlenecks that actually govern most bus fuel islands, ranked by how frequently they turn out to be the real limit when someone finally measures.
Manual Transaction Entry
Bus ID typed into pump keypad, odometer written on paper log, driver name entered from memory. 50-90 seconds per bus that shouldn't exist.Poor Positioning Layout
Head-in bays that force back-out. Narrow aisles that make bus alignment slow. No queuing lane so incoming buses block the exit. All fixable with paint and cones long before concrete.Slow Dispensing Rate
Old dispensing meter running 12-15 GPM when 20-25 GPM standard fleet pumps are the norm and 40 GPM high-flow options exist. Real bottleneck at some depots — but always check items 1 and 2 first.DVIR Done at the Pump
Full post-trip inspection completed while the bus is holding a fueling lane. Steals lane time from the next bus. Post-trip should happen at parking — only the walk-up defect flag belongs at the pump.Route Return Clustering
Every afternoon route ends within a 45-minute window because bell schedules cluster there. Impossible to fully solve; possible to soften by staggering last-mile routes 10-15 minutes apart on the schedule.The top two combined account for most throughput problems at most depots. Neither requires capital. Both are boring compared to "buy a high-flow pump" — and both routinely deliver twice the throughput gain a pump upgrade would. Diagnose before spending.
Island Layout Economics: Head-In vs Pull-Through vs Drive-Through
Layout decides how fast a bus can enter, be served, and exit the island. Three configurations dominate at bus depots, and each carries a real throughput number. If your island is losing time at Step 1 (position) and Step 5 (depart) of the fuel cycle, layout is why.
Head-In / Back-Out
Bus pulls nose-in to the pump, fuels, then reverses out to exit. Common at older depots retrofitted from truck yards.
Pull-Through
Bus enters one end of the island, fuels in a straight-through lane, exits the other end. Dominant layout for new-build bus depots.
Drive-Through w/ Staging
Pull-through layout with a dedicated staging lane before the pump and a defect-flag / DVIR bay beyond it. Buses stage, fuel, then pull forward for full post-trip elsewhere.
A pull-through with a staging lane is almost always the highest-leverage layout choice a depot can make when it is on the table. But most depots inherit the layout they have and cannot rebuild — which is why cycle-time and transaction fixes carry more weight for existing sites. If you are pouring concrete on a new depot right now, get Config C. If you are working with what you have, get to Config B or work Section 06 hard.
The 6 Levers That Move Buses Per Hour
Six operational levers cover almost every practical throughput improvement available to a depot manager who is not adding lanes. Each is ranked below by realistic buses-per-hour gain and by implementation effort, so the highest-ROI moves surface first.
-
01 Automated Bus ID + Odometer Capture
+25-35% throughput LOW EFFORTBus-side telematics or a hardware ID reader auto-populates bus ID, driver, and odometer at the pump. Cuts the transaction step from ~50 sec to ~10-15 sec. Single largest lever on the board.
-
02 Move Full Post-Trip DVIR Off the Pump
+10-15% throughput POLICY ONLYOnly the walk-up defect check happens at the fuel island. Full DVIR happens after parking. Recovers 30-60 seconds per lane. Zero equipment cost.
-
03 Add a Staging Lane
+15-20% throughput MED EFFORTPainted or physical queue lane before the pump means the next bus is positioned the second the previous one departs. Eliminates gap time between cycles.
-
04 Stagger Route End Times
+10-15% throughput MED EFFORTSpace last-mile route arrivals 10-15 min apart on the daily schedule where bell times allow. Softens the peak; more buses served in the same 2.5-hour surge without hitting the ceiling.
-
05 Dedicated Fueler During Peak
+8-12% throughput STAFFINGOne staffer whose only job during the 2:30-5:00 window is running the pump nozzles for each bus while drivers handle post-trip. Especially high leverage where drivers are handling the pump themselves today.
-
06 Upgrade to High-Flow Pumps
+15-25% throughput HIGH COSTMove from 15 GPM to 25 GPM (or 40 GPM high-flow) dispensing. Real gain but real capital — and only worthwhile after Levers 01-04 are exhausted, because it treats the second-biggest problem while the biggest one is still live.
The order matters. Doing Lever 06 first — upgrading pumps — without doing Lever 01 first is common and expensive. The pump can dispense at 25 GPM all it wants; if the transaction takes 90 seconds, the cycle time is still governed by the driver at the keypad, not the diesel through the hose. Fix the software step before the hardware step. Book a demo to see the transaction-step automation running against a live fuel island.
How BusCMMS Turns Fuel Island Data Into Throughput
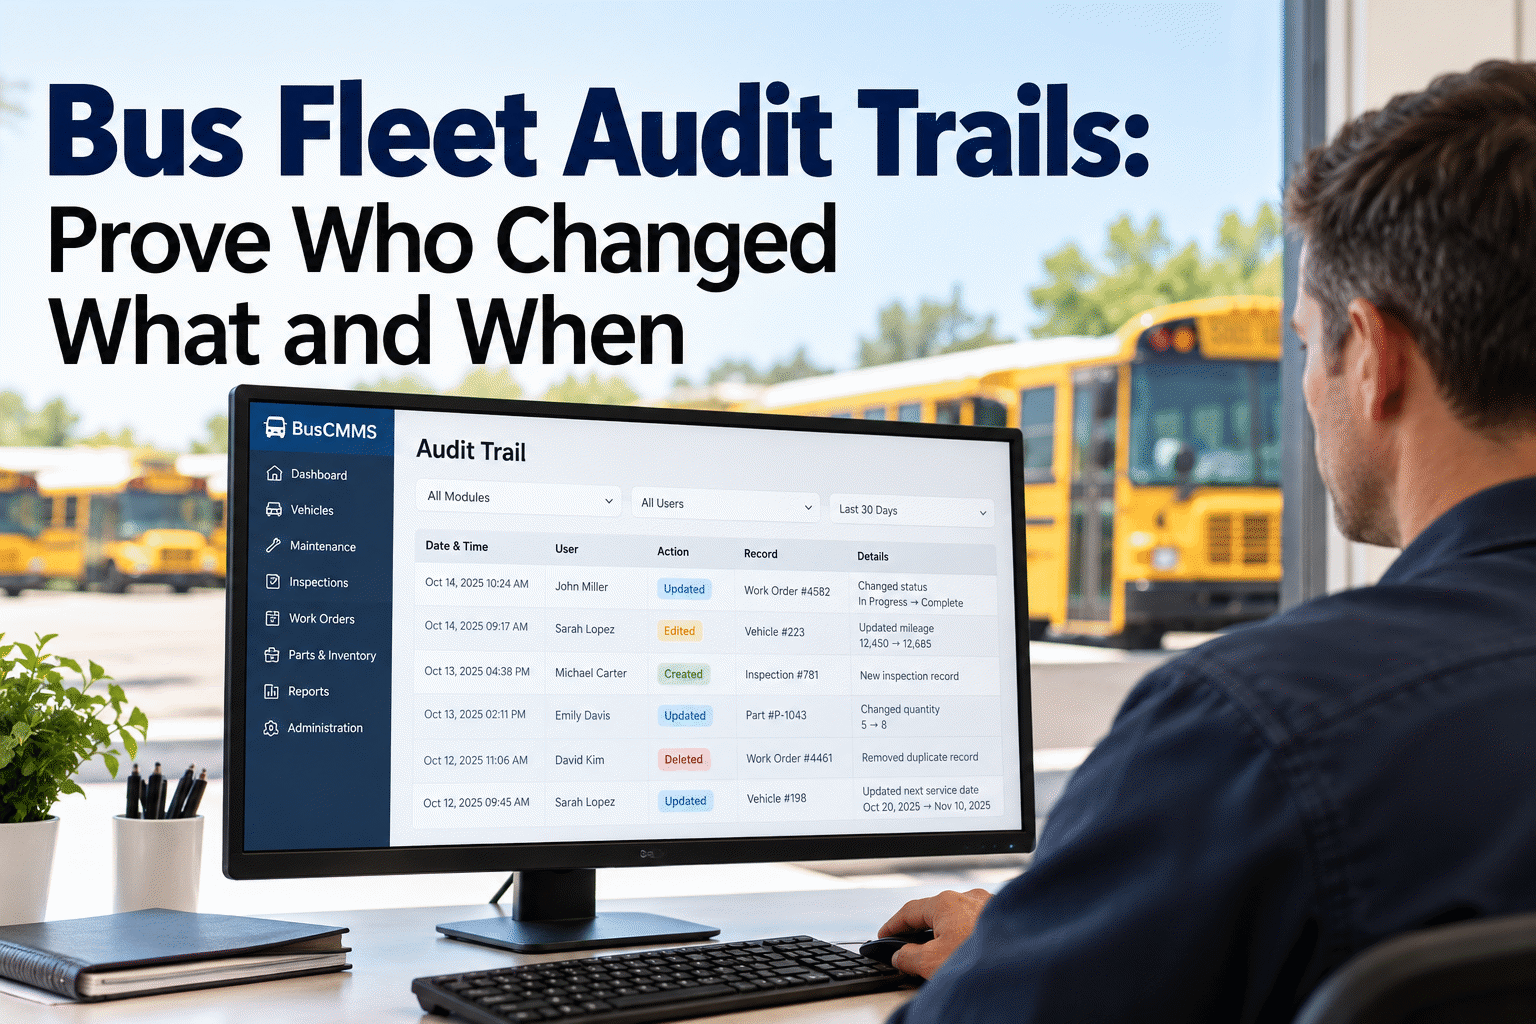
Fuel management in BusCMMS captures every dispense event with its timestamps, bus ID, driver, and odometer reading — which happens to also be the raw data throughput analysis needs. What is measured is what can be moved.
-
Cycle-Time Tracking
Time-at-pump captured per bus. Averages by lane, fueler, and shift trend against target cycle time.
-
Surge Window Analytics
Arrival distribution mapped across the day. See exactly when peak load hits and where it clears.
-
Auto Bus ID + Odometer
Telematics integration auto-populates transaction fields. Cuts pump-side entry from ~50 sec to ~15.
-
Fueler Performance Reports
Cycle time per fueler surfaces training opportunities and identifies the fastest workflows to standardize.
-
Digital Post-Trip DVIR
Drivers complete DVIR at parking on tablet or phone. Only walk-up defect flag lives at the fuel island.
-
Throughput Dashboard
Buses-per-hour by lane, wait time, queue length, and idle fuel burn during queue — all in one operations view.
The dispensing data BusCMMS is already capturing for cost-per-mile analytics is the same data throughput analysis needs. Same feed, second use case — which is why measuring cycle time in a depot that already runs the CMMS costs zero incremental setup effort.
The Practitioner View: What Cycle Timing Actually Found
That is the throughput story you rarely hear from a vendor selling pumps: the second-biggest step in the cycle is usually the one you can fix without buying anything, and the biggest step (dispensing) is often already fine. Measure first, spend second. Sign up free and see your fuel island cycle times pinned to a chart within a week.
The Bottom Line on Bus Depot Fuel Island Throughput
A fuel island is a queueing system, and queueing systems reward cycle-time reduction more than capacity addition. The fastest, cheapest gains almost always come from killing manual transaction entry, moving full DVIR off the pump, and adding a staging lane. High-flow pumps and second-island builds should live at the bottom of the priority list, not the top. Behind all of it is one honest first step: measure what is actually happening at each of the five cycle-stages, then attack the biggest one. That is what turns a chaotic 2:30-5:00 pm surge into a routine that finishes on time every day. Book a walkthrough to see cycle-time diagnostics running on a bus depot like yours.
What is bus depot fuel island throughput?
Fuel island throughput is the number of buses a depot's fueling operation can clear per hour, measured as: Lanes × 60 minutes ÷ average cycle time = buses per hour. A typical bus depot fuel island runs a cycle of 3-6 minutes per bus — covering position, DVIR walk-up, transaction entry, dispensing, and departure. Throughput becomes a problem when the post-route surge (typically 2:30-5:00 pm at school districts) delivers arrivals faster than the island can clear them, creating queues, driver overtime, idle fuel burn, and delayed yard prep.
Where does most fuel island time actually go?
Dispensing is usually the largest single step in the cycle at around 30-40% of total time (typically 60-90 seconds for a 30-40 gallon fill at a standard fleet pump). But transaction entry — typing in bus ID, entering odometer, confirming driver — commonly runs 25-30% of cycle time (50-90 seconds) and is fully controllable via automation. Position and align (~15%), post-trip walk-up (~12%), and departure (~8%) round out the rest. Most depots believe dispensing is their bottleneck; when they finally measure, it is usually the transaction step.
How can I reduce fueling queues without buying new pumps?
Six levers work without hardware upgrades. Automate bus ID and odometer capture at the pump via telematics (biggest gain, 25-35% throughput improvement). Move full post-trip DVIR off the fuel island to parking (10-15% gain, zero cost). Add a painted or physical staging lane before the pump (15-20% gain). Stagger route end times by 10-15 minutes where bell schedules allow (10-15% gain). Assign a dedicated fueler during the peak surge window (8-12% gain). High-flow pump upgrades belong last on the priority list, not first — the cheaper software and layout fixes usually deliver higher throughput gains at a fraction of the capital cost.
What is a good fuel island cycle time for a bus depot?
Well-run bus depots typically hit average cycle times of 3.0-3.5 minutes per bus per lane. Depots running manual transaction entry, full pump-side DVIR completion, and head-in / back-out layouts commonly run 5-6 minutes. The difference between the two is roughly 10 additional buses cleared per hour per lane — enough to convert a chaotic 2.5-hour post-route surge into a routine that ends 45 minutes earlier every day. Target 3.5 minutes as the baseline improvement goal; 3.0 minutes as the operational stretch.
How does BusCMMS help with fuel island throughput?
BusCMMS captures dispensing timestamps as part of standard fuel management, which means cycle time by lane, fueler, shift, and bus becomes an automatic chart rather than a stopwatch exercise. Surge-window analytics show arrival distribution across the day. Telematics integration auto-populates bus ID, driver, and odometer at the pump — cutting the transaction step from around 50 seconds to around 15. Digital post-trip DVIR runs at parking on tablet or phone so only the walk-up defect flag lives at the fuel island. Fueler performance reports identify the fastest workflows to standardize across shifts. All of it runs on the same dispensing data BusCMMS already captures for cost-per-mile analytics, so measuring throughput adds zero incremental setup for depots already on the platform.