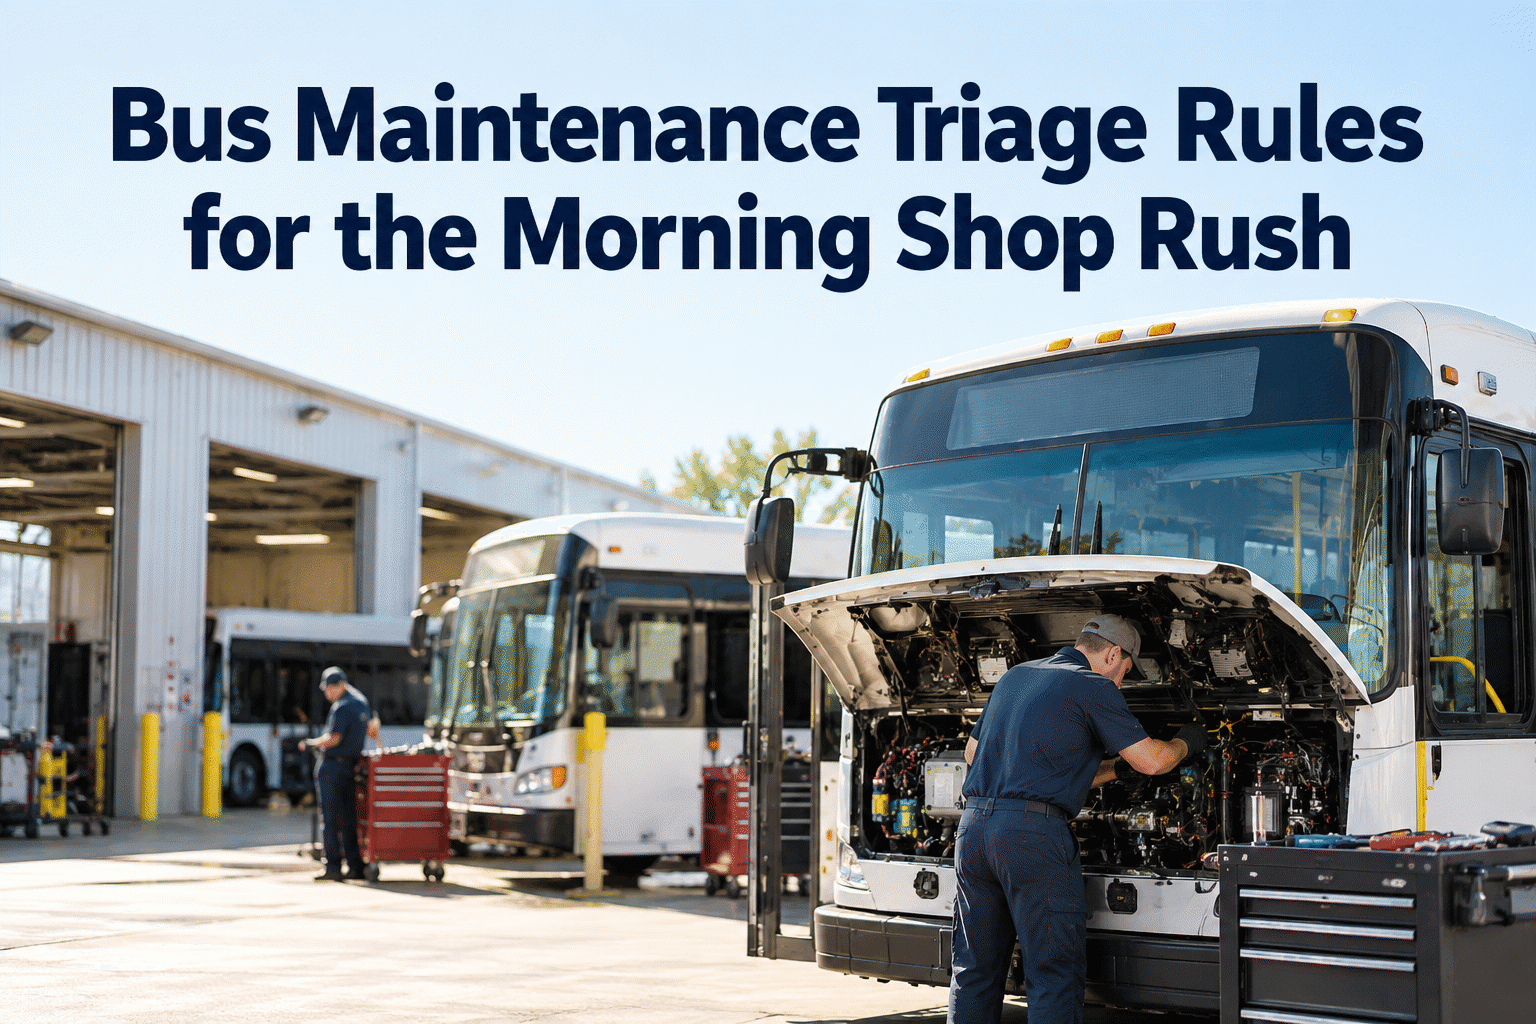
The overtime line is the one that quietly eats your budget. Techs staying past six to finish a job that stalled on a part, weekend call-ins for a road call, the same two people always picking up the extra hours until one of them is earning half-again their base. When the labor number comes in over plan, the question is never just how much — it is what drove it. Bus shop overtime cost drivers are usually a handful of fixable causes hiding behind one big number, and a labor analysis is how you find them. You can see overtime broken down by cause in a short demo.
COST MANAGEMENT · LABOR ANALYSIS
Bus Shop Overtime Cost Drivers: Labor Analysis and Improvements
Overtime is a symptom, not a cause. Most of it traces to a few drivers — unplanned breakdowns, parts delays, rework, workload peaks — and each one has a fix that is cheaper than the premium you are paying. Here is how to find your drivers and cut the avoidable hours.
WHERE THE OVERTIME HOURS ACTUALLY GO
Illustrative mix. The biggest slice is almost always unplanned work — a breakdown that forced someone to stay. That matters because unplanned overtime is the kind you can actually design out, while a true staffing gap is the kind you cannot.
Planned vs Unplanned: The Overtime Split That Matters Most
Not all overtime is a problem. Sometimes you keep a tech an extra hour to finish a PM and put the bus back on the road — that is planned overtime, and it can be the cheapest hour you spend. The overtime that hurts is the kind you did not choose: a road call at five o'clock that forces someone to stay. Split your hours this way and the fixable share jumps out.
PLANNED VS UNPLANNED OVERTIME
Illustrative split. The planned slice is a tool you use on purpose; the unplanned slice is the budget leak. Reducing overtime is not about cutting the hours you chose — it is about removing the emergencies that forced the rest.
Here is the trap that makes overtime so hard to shake. When PM gets deferred because the crew is slammed, buses break down more. More breakdowns mean more emergency overtime. The techs burning that overtime are now too busy to catch up on PM — so more of it gets deferred, and the cycle tightens. Overtime stops being a staffing problem and becomes a planning one.
HOW OVERTIME FEEDS ITSELF
Illustrative. The only place to break the loop is at the top: get preventive maintenance back on schedule and the breakdowns that drive emergency overtime start to fall — which frees the hours to keep PM on schedule.
Each Overtime Driver Has a Fix That Beats the Premium
Overtime pays a premium — often time-and-a-half — so every avoidable hour costs more than a regular one. The good news is that each driver maps to a lever you already have. Match the cause to the fix and you spend regular hours preventing the overtime instead of paying the premium on it.
DRIVER → THE LEVER THAT CUTS IT
Illustrative. Four of the five drivers are planning problems you can fix with scheduling and parts. The last one — a real staffing gap — is where overtime is sometimes the right call, cheaper than a hire you cannot justify for a seasonal peak.
You do not need a consultant to start — you need to ask a few questions of your own labor data. Run these and the biggest avoidable driver usually names itself in an afternoon.
What share of OT is reactive?Tag each overtime job planned or unplanned — the reactive share is your fixable ceiling.
START
How much OT is parts-wait?Hours a tech stayed late because a part was not on the shelf are a purchasing fix, not a labor one.
START
Which buses generate the most?A few aging units driving repeat emergencies is a replace-or-overhaul case, not an overtime one.
START
Is it the same few people?Overtime piling on two techs is a burnout and single-point-of-failure risk worth spreading or scheduling.
CHECK
Does it spike on a pattern?If OT jumps every Monday or every winter, it is a workload-leveling problem you can schedule around.
How BusCMMS Turns Overtime Into Something You Can Fix
You cannot reduce an overtime driver you cannot see. BusCMMS captures the labor data that makes a real analysis possible — and then runs the scheduling and parts planning that goes after the top causes directly.
Labor tagged by cause
Every work order logs hours as planned or reactive, so overtime sorts by driver — breakdown, parts wait, rework — not one lump line.
PM compliance vs overtime
A dashboard shows reactive work and overtime moving against PM compliance, so the spiral is visible before it tightens.
PM scheduling that holds
Keeping preventive maintenance on schedule is the one lever that shrinks the breakdowns driving most emergency overtime.
Parts staged ahead
Work orders list the parts a job needs so inventory can stage them — no tech staying late waiting on a shelf.
1.5×typical overtime premium — every avoidable OT hour costs more than a regular one25–35%maintenance cost reduction within 12 months, as reported by BusCMMS2–4 wkstypical rollout — bus-specific, so labor analysis starts fast
The 25 to 35% figure is BusCMMS's own reported customer result; the overtime premium is simply how time-and-a-half works — and together they are why cutting avoidable overtime moves the budget so fast.
A Transportation Director's Take
Key Takeaways on Bus Shop Overtime Cost Drivers
Overtime is a number with causes behind it — find them and most of it is fixable. Four things to hold onto.
01
OT is a symptom
The total hides the drivers — break it down by cause before you react to it.
02
Split planned from forced
The unplanned share is the budget leak; the planned share is a tool you keep.
03
Break the spiral at PM
Deferred PM feeds the emergencies that feed the overtime — fix it at the top.
04
Hiring is not the first move
Most overtime is a planning problem; a new tech alone can still spiral.
Break the number into its drivers, split planned from forced, and attack the reactive share with PM and parts planning — and bus shop overtime goes from a line you dread to one you control. The hours you keep paying should be the ones you chose, not the ones a breakdown chose for you.
FAQ
Bus Shop Overtime: Common Questions
What drives overtime in a bus maintenance shop?+
Most of it comes from a handful of causes: unplanned breakdowns that force a tech to stay, parts waits that leave a job half-done at quitting time, rework when a repair does not hold, workload peaks when too much lands at once, and true understaffing. The biggest slice is almost always unplanned work — a road call or emergency that nobody scheduled. That distinction matters: unplanned overtime you can design out with better preventive maintenance and parts planning, while a genuine staffing gap you cannot. A labor analysis that tags each overtime hour by cause shows you which driver is actually costing you, so you fix the right thing instead of assuming you are simply short on people.
How do I analyze my bus shop's overtime costs?+
Start by splitting overtime into planned and unplanned — hours you chose to run late versus hours an emergency forced. The unplanned share is your fixable ceiling. From there, group the unplanned hours by cause: how much was parts-wait, how much was rework, which buses generated the most emergencies, and whether it falls on the same few people or spikes on a pattern like every Monday or every winter. Each answer points at a different fix: parts-wait is a purchasing problem, repeat-offender buses are a replace-or-overhaul case, a seasonal spike is a scheduling one. You do not need a consultant — just labor data tagged well enough to sort by cause. The biggest avoidable driver usually becomes obvious in an afternoon.
Is reducing overtime just a matter of hiring more techs?+
Usually not, and assuming so is the common mistake. If your overtime is driven by unplanned breakdowns — and most shops' is — adding a tech without fixing the breakdowns just gives you more people to run into the same overtime spiral: deferred PM causes breakdowns, breakdowns cause emergency overtime, and the busy crew defers more PM. You can staff up and still spiral. The lever that actually breaks it is getting preventive maintenance back on schedule, which shrinks the breakdowns driving the emergencies. Hiring is the right answer only when the analysis shows a real, sustained workload regular hours cannot cover — and even then, for a seasonal peak, planned overtime often beats a permanent hire you cannot justify year-round.
What is the difference between planned and unplanned overtime?+
Planned overtime is overtime you chose on purpose — keeping a tech an extra hour to finish a PM so the bus rolls in the morning, or scheduling weekend hours to clear a known backlog. It is a tool, and often a cheap one, because it buys availability you need. Unplanned overtime is forced on you: a road call at five o'clock, a breakdown that has to be fixed tonight, a job that stalled and now someone has to stay. That is the budget leak, because it is unpredictable, it usually carries the full premium, and it is a sign something upstream failed. The goal of an overtime analysis is not to eliminate all overtime — it is to shrink the unplanned share while keeping the planned hours you actually want.
How does BusCMMS help reduce overtime costs?+
BusCMMS makes overtime analyzable and then goes after the causes. Every work order logs labor hours and tags them planned or reactive, so overtime sorts by driver — breakdown, parts wait, rework — instead of landing as one line on a report. A dashboard tracks reactive work and overtime against PM compliance, so you can see the spiral forming before it tightens. Then the tools that fix the top drivers are built in: PM scheduling that holds keeps preventive work on track and cuts the breakdowns behind most emergency overtime, and work orders that list required parts let inventory stage them so no one stays late waiting on a shelf. BusCMMS reports maintenance cost reductions of 25 to 35% within 12 months, a company-reported figure from its own data, and avoidable overtime is one of the first lines to move because every hour of it carries a premium.