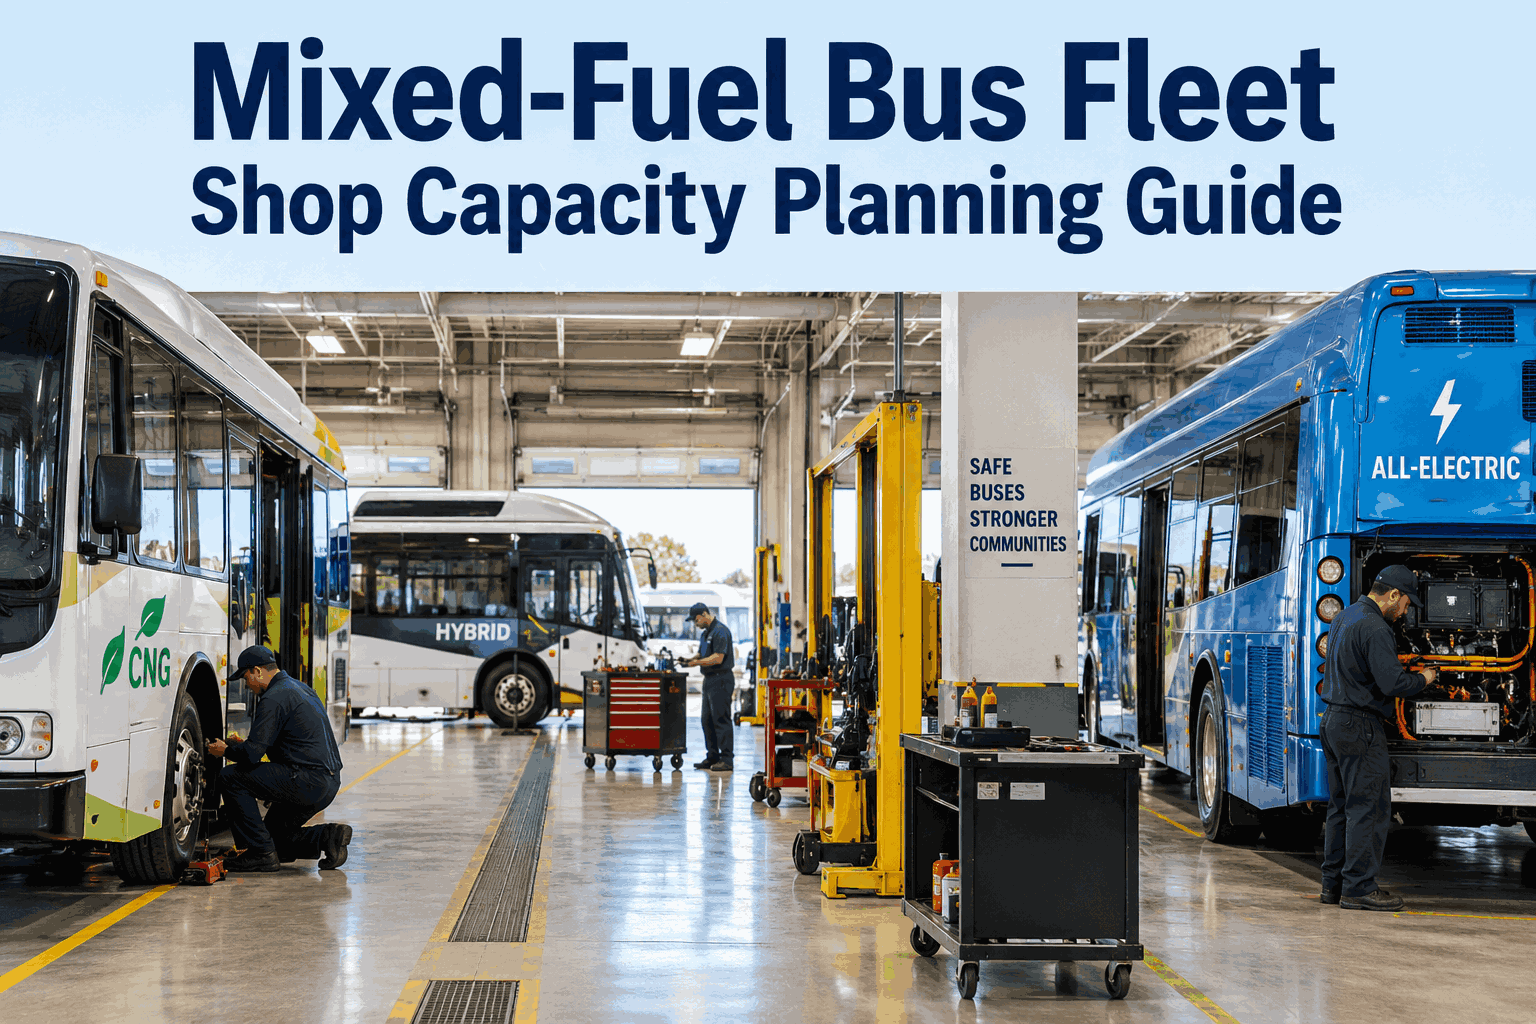
The board approves 15 battery-electric buses on top of the existing 40 diesel and 20 CNG. Nobody asks the shop. Two years later PM is backlogged because the one HV-qualified tech is consumed on electrics and there is no dedicated EV bay. Mixed fuel bus fleet capacity planning is the workload math, cert stack, bay allocation and forecasting that should have happened before the vote.
Mixed-Fuel Bus Fleet Shop Capacity Planning
Why Mixed-Fuel Fleets Break Traditional Shop Math
A single-fuel bus shop runs on a simple equation: fleet size × PM cadence × average labor hours per work order. Mix diesel with CNG and add battery-electric, and none of those three variables is the same across the fleet anymore. Labor hours per PM differ by fuel type. Cadence differs. Skill certifications differ. Bay requirements differ. Tooling differs. Even the safety envelope around the bus while it sits in the bay differs.
The mix in the bar above is a real position many U.S. transit agencies now find themselves in. Not a future scenario — a current one. And the shop that made sense for 60 diesel buses in 2018 does not make sense for that mix in 2026. Capacity planning is the exercise of figuring out what has to change, in what order, by when. Book a walkthrough to see workload projected across a real mixed-fuel fleet composition.
The Labor-Hour Multiplier: What Each Fuel Type Actually Costs the Shop
Same PM interval, same shop, same bay footprint — but the labor hours are not the same. A diesel A-service is not a CNG A-service. And nothing about a diesel A-service prepares a tech for the pre-work isolation, PPE, and lockout ritual of touching a battery-electric bus. The multiplier below is directional — every fleet will calibrate it against their own work-order history — but the pattern holds across most agencies.
Two things jump out. First, electric buses need meaningfully less routine labor overall — no oil, no transmission fluid, no aftertreatment, minimal brake wear from regenerative braking. Second, that lower total gets partly eaten by the pre-work overhead — the qualified-technician isolation and lockout adds real minutes to every work order, even the small ones. Third (and hidden in the CNG row): the CGA C-6.4 cylinder inspection cadence adds a workload spike that a diesel-only shop never budgeted for.
Bay Allocation: The Shop Floor Is Not Neutral
A diesel bus can go in any bay. A CNG bus cannot — the bay needs methane detection, adequate ventilation, and ideally overhead exhaust rated for CNG service. A battery-electric bus needs isolation from live-work adjacent bays, ideally a dedicated HV bay with proper barriers, first-response fire suppression sized for lithium chemistry, and space around the bus for the pre-work safety perimeter. The shop floor plan below is a simplified sketch of what this looks like in a real 8-bay depot.
The 8-bay depot above supports the 75-bus mixed fleet from the fleet-mix bar with real breathing room. Drop below 6 bays, or squeeze the two EV bays into shared use, and utilization tips over 85% — which sounds efficient but leaves no cushion for surge repair work. The rule that keeps repeating in agencies that do this well: leave capacity, not utilization, on the table.
The Technician Certification Stack
Every fuel type carries its own certification and training path. These are not overnight courses — a shop that decides in Q1 that it needs high-voltage qualified technicians will typically not have them fully certified and experienced until 12-18 months later. Certification lead time is the constraint most agencies underestimate.
Diesel · Baseline
Established path · ASE T-seriesASE T-series certifications (T1 gasoline engines through T8 preventive maintenance), OEM engine training (Cummins, Detroit, PACCAR), aftertreatment / DPF regeneration training. Most experienced shop staff already have this.
CNG · Cylinder & Fuel System
6-12 month path · CGA / OEMCGA C-6.4 cylinder inspector qualification is the anchor credential. Add OEM fuel-system training (Cummins Westport, ISL G, ISX12N), methane leak-detection procedures, and depot-specific safe-work procedures for high-pressure fuel systems.
Electric · NFPA 70E Qualified
12-18 month path · formal HV qualNFPA 70E qualified-person training for high-voltage work, OEM HV-drive training (Proterra, New Flyer, Gillig, BYD), traction-battery service certification, lithium-ion safety and thermal-event response. This is a formal qualification path with re-certification requirements.
Hydrogen · Emerging (if applicable)
18-36 month path · still formingFor fleets piloting fuel-cell electric buses (FCEBs). Adds hydrogen gas safety, high-pressure fuel systems, fuel-cell stack service, and flame detection procedures on top of the EV-HV cert. Very small pool of qualified U.S. techs today.
A shop building a mixed-fuel bench should map each current technician against this stack and ask a hard question: if I lose two people to retirement in the next 24 months, do I have coverage on every fuel type on every shift? The answer for most agencies is no. That gap is the recruiting and training plan.
Tooling Gaps: What Each Fuel Type Adds to the Shop Bill
The shop that already services diesel already owns most of what it needs for diesel. CNG and electric each add specific gear, some of which is not optional. This is the checklist most fleets miss until the first CNG bus rolls in and there is nowhere to look up the cylinder inspection procedure.
Already In Place
- Overhead lifts · bus-rated column or in-ground
- Diagnostic scan tools (JPRO / Cummins Insite / Detroit DiagnosticLink)
- DPF cleaning · contracted or in-house
- DEF storage & dispensing (ISO 22241)
- Fluid recovery & disposal
Infrastructure & Tools
- Methane detection (bay-level continuous monitor)
- Bay ventilation upgrade to CNG service rating
- CGA C-6.4 cylinder inspection kit · visual & ultrasonic
- High-pressure defueling / venting equipment
- Cummins Westport ISL G / ISX12N scan tools
- Fuel-system leak detection instruments
HV Safety & Diagnostic
- HV-rated PPE · Class 0/2 gloves, arc-flash apparel
- Insulated tool sets (1000V rated)
- Isolation & LOTO devices · HV rated
- OEM traction-battery diagnostic laptops
- Lithium-rated fire suppression · F500 or equivalent
- Insulation resistance tester · megger
- Traction-motor bearing service tools (OEM-specific)
The trap most agencies fall into is budgeting the bus purchase without budgeting the shop retrofit that has to happen before the first bus can be serviced. On a 15-bus EV order, the incremental shop-side gear alone can run $150K-$400K depending on how much of the depot floor plan needs modification. That number belongs in the fleet-composition business case, not in a surprise Q3 request the following year.
Forecasting: Small, Mid, and Large-Fleet Capacity Scenarios
Capacity planning gets specific fast at fleet size. Three scenarios show how the shop math shifts as the mix scales.
25-40 Bus Fleet
- Mix: Likely diesel-dominant with pilot EV or CNG unit(s)
- Bays: 3-4 total. Convert one to CNG or EV dedicated as needed.
- Techs: 4-6 with cross-training. Split cert paths across shifts.
- Constraint: Certification lead time — can't cross-train fast enough.
50-100 Bus Fleet
- Mix: Meaningful presence of 2-3 fuel types
- Bays: 6-10 with 2 dedicated by fuel type
- Techs: 8-15. Specialization by fuel type becomes practical.
- Constraint: Bay availability during peak PM cycles.
150+ Bus Fleet
- Mix: Full three-fuel or four-fuel (add hydrogen for pilot)
- Bays: 12-20 with fuel-specific zones & safety separation
- Techs: 20+. Formal specialization by fuel plus general utility.
- Constraint: Coordination overhead — scheduling matters as much as capacity.
The small-fleet scenario is where certification lead time bites hardest — a shop of five techs can't send one person to NFPA 70E training for weeks without losing coverage. The mid-fleet scenario is where bay planning matters most, and the large-fleet scenario is where analytics and workload projection start to earn their keep — the human brain can no longer track shop capacity across 20 techs, 15 bays, and 200 buses simultaneously. Sign up free and start rolling up work-order hours by fuel type this week.
A Real Agency: Victor Valley Transportation Authority
Victor Valley Transportation Authority
San Bernardino County, CaliforniaPer Mass Transit Magazine's coverage of VVTA's mixed-fleet practice, the agency runs three propulsion technologies in active revenue service. Managing that mix required specific investments: three CNG compressor skids on site; planned liquid hydrogen delivery with an interim gaseous solution; 100kW plug-in charging stations for electric buses. Shop and facility upgrades were required to add hydrogen to an existing CNG operation, including methane and hydrogen gas detection and flame detection for hydrogen.
On the workforce side, VVTA emphasizes that technicians must be knowledgeable and trained on each fuel type. High-voltage systems on BEBs and FCEBs require qualified technicians, strict safety practices, standard operating procedures, and proper PPE aligned with NFPA 70E. The CNG side still requires current inspection standards like CGA C-6.4. VVTA supplements OEM training with the California Transit Training Consortium and uses a train-the-trainer approach, balancing cross-training with specialization.
The VVTA operation is instructive because it shows the shop-side cost of a mixed fleet is not abstract. Every fuel added to the mix carried its own infrastructure, its own detection systems, its own certifications, and its own training partnerships. The agency did not stumble into that. It planned for each layer. That planning discipline is what shop capacity work is actually about.
How Analytics Turns Capacity Planning Into a Live Function
The features that matter for mixed-fuel capacity planning are all analytics-driven — work order data rolled up in ways that answer capacity questions.
-
01
Work-Order Hours by Fuel Type
Actual labor hours logged per PM, per repair, per fuel type. Real numbers, not multipliers — calibrated against your shop, your techs, your bus mix.
-
02
Bay Utilization Analytics
Hours per bay, per day, per week. Surfaces the CNG bay running 92% while a diesel bay sits at 58% — the fleet-composition signal buried in the schedule.
-
03
Technician Certification Registry
Every tech's active certs, expiration dates, and coverage on which fuel types across which shifts. The single-point-of-failure map before a retirement or resignation.
-
04
PM Cadence Modeling
Configure separate PM logic per fuel type (mileage vs calendar, cylinder inspection intervals, battery thermal checks). Workload forecast pulls from the mix, not the average.
-
05
Fleet-Composition Forecasting
Model a proposed FY27 mix — add 15 EV, retire 10 diesel, hold CNG — and see projected labor hours, bay demand, and technician coverage gap. Board-decision math.
-
06
Board-Ready Capacity Reports
One-click export of shop workload, capacity headroom, and projected gaps for fleet-composition decisions. Replaces the spreadsheet the director has been maintaining by hand.
The Bottom Line on Mixed-Fuel Fleet Capacity Planning
A mixed fuel bus fleet is not a diesel fleet with some other buses in it. It is a fundamentally different shop-capacity problem. Labor hours per work order differ by fuel type. Bays are not interchangeable. Certifications carry 12-18 month lead times. Tooling gaps run into six figures. The agencies that handle this well do the workload math before the fleet-composition vote, forecast bay and technician coverage 18 months forward, and treat every fuel-type addition as a shop retrofit with its own budget line. The agencies that don't handle it well find out about the gap when the buses arrive and there is no one qualified to touch them. Book a demo to see mixed-fuel capacity forecasting on a fleet your size.