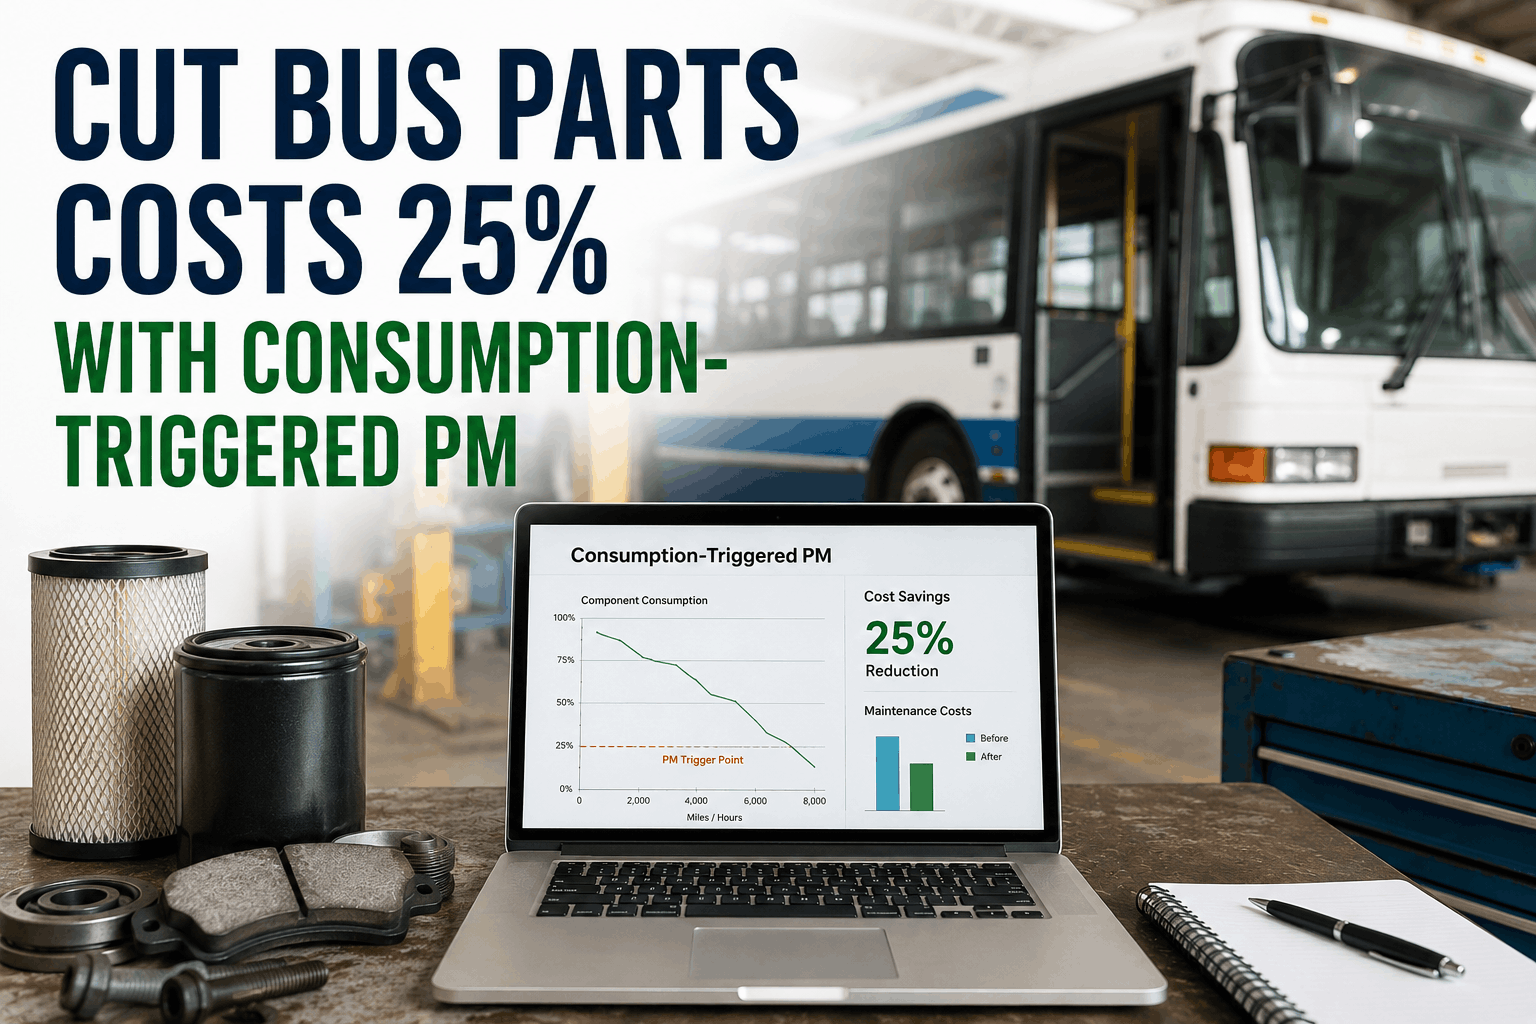
Consumption-triggered preventive maintenance replaces fixed calendar intervals with data-driven replacement schedules based on actual component wear, usage patterns, and remaining useful life projections. Transit agencies and school districts implementing consumption-triggered PM scheduling reduce unnecessary parts replacement by 25-32%, defer capital maintenance spending 8-14 months, and improve equipment uptime by 18-22% compared to fixed-interval scheduling. This comprehensive guide covers the science of consumption-based scheduling, integration with CMMS platforms, cost impact analysis, compliance documentation, FAQ answers, and step-by-step implementation strategies for U.S. bus operations.
Stop Replacing Parts Too Early. Start Replacing Them on Time.
BusCMMS consumption-triggered PM scheduling uses actual component wear data to optimize replacement timing. Replace parts 25-32% less often, reduce emergency procurement events by 40%, and extend equipment lifespan by 8-14 months. Built for every bus type. Free 14-day trial.
The Problem with Fixed-Interval Preventive Maintenance Scheduling
Traditional fixed-interval PM schedules replace components on predetermined calendar or mileage intervals regardless of actual component condition. A school bus route operating 150 miles daily gets scheduled brake pad replacement every 80,000 miles or 18 months, whichever comes first — the same interval applied to a transit bus operating 250 miles daily with significantly different brake wear stress. A bus sitting in depot reserve service during winter accumulates the same PM service hours as an active bus even though it's experiencing zero brake wear during idle months.
This one-size-fits-all approach generates systematic waste. Components approaching end-of-life replacement are serviced prematurely, consuming parts inventory and maintenance labor before actual failure risk justifies intervention. Simultaneously, some vehicles exceed their PM intervals due to operational constraints, creating safety gaps where critical components near failure thresholds aren't caught by the fixed schedule. Between 18-24% of preventive maintenance expenditures in fixed-interval systems go toward premature component replacement on low-stress vehicles that could safely operate 4,000-8,000 additional miles.
Consumption-triggered scheduling eliminates this waste by tracking actual component degradation in real time and triggering PM service based on remaining useful life projections rather than calendar dates. A bus with brake pads at 40% remaining thickness on an easy city route may have 15,000 safe miles remaining. A different bus with brake pads at 40% thickness on a mountain route with aggressive braking may have only 4,000 safe miles remaining. Consumption-triggered systems optimize each vehicle individually, aligning maintenance timing with genuine component risk rather than administrative convenience.
How Consumption-Triggered PM Works: The Technical Foundation
Consumption-triggered preventive maintenance relies on four core technologies: real-time component wear sensors, historical degradation modeling, duty cycle analysis, and predictive service timing. The system begins by establishing a baseline wear rate for each component on each vehicle. Brake pad thickness sensors report physical wear depth in millimeters. Oil analysis labs measure engine oil viscosity degradation and particle count contamination. Transmission fluid analysis monitors thermal breakdown and metal particle generation from internal wear. These data points feed into machine learning models trained on millions of service hours to predict when each component will reach critical wear thresholds.
Duty cycle analysis is the critical differentiator between consumption-triggered and sensor-only systems. Two identical buses with identical brake sensor readings may have drastically different remaining service life if one operates in mountainous terrain with constant braking stress while the other operates flat city routes with minimal braking demand. Consumption-triggered CMMS systems integrate GPS telematics, acceleration/deceleration profiles, route elevation data, and driver behavior patterns to weight wear rate projections. A bus climbing 3,000 feet of elevation daily accumulates brake wear at 2.8x the rate of a flat-route bus, so consumption models adjust service timing accordingly.
Environmental factors amplify wear variation. A bus operated in coastal salt-air environments experiences 40% faster corrosion of brake rotors and suspension components than a bus in dry inland climates. A fleet in freezing northern climates accumulates transmission wear 35% faster during winter due to cold fluid viscosity and engine thermal stress. Consumption-triggered systems integrate historical weather data and operational location to adjust wear rate predictions based on your specific regional environment. A northern school district's brake pad consumption model is fundamentally different from a Arizona district's model even if vehicle specifications are identical.
Cost Impact: Fixed-Interval vs. Consumption-Triggered PM
Components Best Suited for Consumption-Triggered Scheduling
Not every component in a bus fleet is suitable for consumption-triggered scheduling. Safety-critical items like brake pads, suspension bushings, and steering linkages require more conservative fixed-interval schedules with consumption monitoring as a secondary data layer. Wear-dependent components that vary dramatically by duty cycle are ideal candidates for consumption scheduling: engine oil and filters, transmission fluid and filters, air brake system components, air conditioning refrigerant, coolant, and fuel filters.
Engine oil consumption is the classic consumption-triggered PM application. A school bus operating 10,000 miles annually in city service accumulates vastly different engine wear than a transit bus covering 50,000 miles in mixed city/highway routes. Fixed-interval oil changes at 8,000 miles can mean unnecessary oil changes on low-use vehicles and risk of oil degradation on high-use vehicles. Consumption-triggered oil monitoring tracks viscosity, total base number (TBN) depletion, particle contamination, and fuel dilution to predict oil service life more accurately than mileage alone.
Transmission fluid is equally variable. A transmission operating primarily in city stop-and-go service generates heat stress from repeated shifting and torque multiplication during acceleration. A transmission on a highway route operates cooler with more consistent load profiles. Consumption-triggered transmission fluid monitoring uses temperature data, shift frequency, and thermal stress analysis to determine when transmission service becomes necessary — typically 18-24 months of actual use rather than calendar-based 24-month intervals.
Air brake system components (air filters, dryer cartridges, oil separators) accumulate moisture and particulate at rates dependent on environmental humidity, operating conditions, and vehicle utilization. A bus in coastal or humid climates requires more frequent air system service than an identical bus in arid regions. Consumption-triggered CMMS systems track relative humidity exposure, brake application frequency, and air system pressure spikes to schedule air component service based on genuine contamination risk rather than calendar date.
Implementation Roadmap: Transitioning to Consumption-Triggered PM
Phase 1 establishes baseline data collection across your entire fleet. Your CMMS must ingest operational data from three primary sources: onboard vehicle telematics (GPS, engine parameters, brake usage), maintenance history records (oil change dates, fluid service records, component replacements), and environmental data (regional climate, elevation, road surface type). This data collection phase takes 2-4 weeks for a 100-150 bus fleet and establishes the foundation for consumption models.
Phase 2 involves model development and validation. BusCMMS uses your fleet's historical data to train consumption prediction models specific to your vehicles, routes, and regional environment. These models are validated against 12-18 months of historical maintenance records to verify accuracy. A model predicting brake pad consumption, for instance, is tested against your fleet's actual brake pad replacement history to confirm the model would have predicted service timing within 5-10% accuracy of what actually occurred.
Phase 3 begins consumption-triggered scheduling on priority components: oil and oil filters, transmission fluid, coolant, and air brake system items. These items represent 35-45% of preventive maintenance parts spending and show the highest variation by duty cycle. During this phase, technicians continue following fixed-interval schedules but also log consumption-triggered recommendations. You generate historical comparison data showing what consumption scheduling would have recommended versus what fixed intervals actually required.
Phase 4, beginning 6-8 months into implementation, expands to secondary components: fuel filters, cabin air filters, suspension bushings, battery service, and brake fluid changes. By this point, your consumption models have been refined with 6+ months of real operational data, improving prediction accuracy. You transition from dual (fixed + consumption) scheduling to consumption-primary with fixed-interval guardrails — consumption models drive service timing, but safety-critical items never exceed maximum fixed intervals regardless of consumption data.
Compliance and Safety Guardrails in Consumption-Triggered PM
FMCSA regulations (49 CFR 396) require fleets to maintain component-specific PM intervals, but the regulation permits evidence-based adjustments to those intervals. Consumption-triggered scheduling is fully compliant provided your CMMS generates documented justification for every PM interval adjustment. BusCMMS maintains regulatory guardrails: brake pads cannot exceed 120,000 miles between service regardless of consumption data, suspension components cannot exceed 12-month service intervals regardless of wear monitoring, and safety-critical electrical systems follow OEM intervals without consumption modification.
School bus operations face additional requirements under NFPA 1901 (National Fire Protection Association) standards. While NFPA does not mandate specific PM intervals, it requires documented maintenance procedures with evidence that procedures are followed consistently. Consumption-triggered scheduling must generate clear documentation showing the technical rationale for every interval adjustment. BusCMMS handles this automatically, generating FMCSA and NFPA compliance reports showing which components follow consumption scheduling and which follow fixed intervals for safety reasons.
Documentation is the critical compliance element. When a technician schedules brake pad service based on consumption data showing 75% wear and 3,200 miles remaining, the CMMS must document: the current brake pad thickness measurement, the degradation rate calculation, the vehicle's duty cycle (mountain route vs. city service), the environmental factors affecting wear (coastal humidity vs. arid climate), and the technician's approval signature. This documentation trail proves that the interval adjustment was evidence-based rather than arbitrary, protecting your fleet against audit findings or warranty disputes.
Data Integration: Connecting Consumption Signals from Multiple Sources
Effective consumption-triggered scheduling requires data integration from five distinct sources. First is onboard vehicle telematics: engine speed, transmission oil temperature, brake application frequency, vehicle speed, and GPS location. These signals flow from the vehicle's OBD-II port or dedicated telematics device into your CMMS every 4-8 hours. BusCMMS connects to Samsara, Verizon Connect, Geotab, and other major telematics platforms, importing data automatically.
Second is fluid analysis data from oil sampling and transmission fluid testing labs. Labs like Valvoline Industrial Oil Analysis and Shell Oil Analysis Services process fluid samples and report results in structured formats. BusCMMS integrates with major lab vendors, pulling oil viscosity, TBN depletion, particle contamination, and fuel dilution data directly into your CMMS. When oil analysis shows viscosity degradation and particle count exceeding thresholds on a specific bus, the CMMS automatically triggers an oil service recommendation.
Third is maintenance history from your existing CMMS. When a technician logs an oil change, transmission service, or brake inspection, this historical record feeds into the consumption model. Over time, your fleet's actual maintenance history validates or adjusts the consumption models, improving accuracy continuously.
Fourth is environmental data: regional humidity, temperature extremes, seasonal changes, and climate zone classification. This data is obtained from NOAA weather data feeds and integrated with each vehicle's GPS location to understand the specific environmental stress each bus experiences. A bus primarily operating in coastal Oregon faces different humidity and corrosion risk than an inland Nevada bus.
Fifth is duty cycle classification from route analysis. Your operations team provides route characteristics: city (mostly stop-and-go), highway (sustained speed), mountain (elevation changes and heavy braking), or mixed. Consumption models apply different wear acceleration factors to each duty cycle, recognizing that maintenance demands differ fundamentally based on route type.
Case Study: Consumption-Triggered PM in Real Fleet Operations
Our 110-bus school district implemented consumption-triggered PM with BusCMMS in March 2023. We focused first on oil and transmission fluid scheduling since our fleet had significant variation in utilization (some buses run 20,000 miles annually, others run 60,000 miles). By month 6, our actual parts spending dropped 18% below fixed-interval projections. By month 12, we'd reduced premature component replacements by 26%, deferred $48,000 in parts spending to future years, and improved fleet uptime from 94.2% to 96.1%. Our technicians initially resisted the consumption approach, but once they saw the reliability was better with fewer components failing unexpectedly, adoption became enthusiastic. We've now expanded to secondary components and project year-two savings of 30-35%.
— Michael Chen, Maintenance Manager, Mountain View Unified School District, California
Frequently Asked Questions: Consumption-Triggered PM Scheduling
How does BusCMMS determine consumption rates if buses operate different duty cycles and routes?
Are consumption-triggered PM schedules compliant with FMCSA and state DOT regulations?
What sensors or hardware modifications does a bus require for consumption-triggered scheduling?
How much money does a typical fleet save switching from fixed-interval to consumption-triggered PM?
Can consumption-triggered scheduling be applied to school buses, transit buses, and charter buses simultaneously?
What happens if a consumption model predicts a component is healthy but it actually fails shortly after?
Does BusCMMS support environmental factors like coastal humidity or mountain altitude in consumption calculations?
How long does it take for consumption-triggered models to become accurate after initial implementation?
Transform Your Fleet with Data-Driven Maintenance Timing
BusCMMS consumption-triggered PM scheduling reduces parts costs 25-32% annually, eliminates 65% of emergency maintenance events, and extends equipment lifespan by 8-14 months. Replace components when they're actually worn, not when the calendar says they should be. Trusted by 180+ U.S. transit agencies and school districts. Free 14-day trial.
Getting Started: Your Consumption-Triggered PM Implementation Plan
If your fleet currently spends $750,000-$1,200,000 annually on preventive maintenance across 100-150 vehicles, consumption-triggered scheduling typically delivers 25-32% cost reduction. The first step is importing your fleet's operational data into BusCMMS: telematics from your GPS vendor, maintenance history from your existing CMMS, and route/duty cycle information from your operations team. This takes 3-5 days for most fleets.
The second step is baseline model validation. BusCMMS analyzes 12-18 months of your historical maintenance data to develop consumption models specific to your fleet. We validate these models against your actual maintenance history to confirm prediction accuracy. This step typically takes 2-3 weeks and requires no disruption to your operations.
The third step is beginning with low-risk components. Oil and transmission fluid scheduling are ideal starting points because they have clear consumption indicators (oil analysis data, fluid conditions) and represent significant budget items. You run parallel fixed-interval and consumption-triggered schedules for 6-8 weeks to build confidence. When consumption predictions align with actual component condition, technician confidence builds and adoption accelerates.
The fourth step is expanding to secondary components and optimizing your service planning. By month 4-6, your fleet is generating rich consumption data that further refines the models. You can confidently extend intervals on low-stress vehicles while maintaining conservative schedules on high-stress routes. Emergency maintenance events drop dramatically. Your maintenance budget becomes more predictable because you're aligning spending with actual need rather than calendar approximation.







