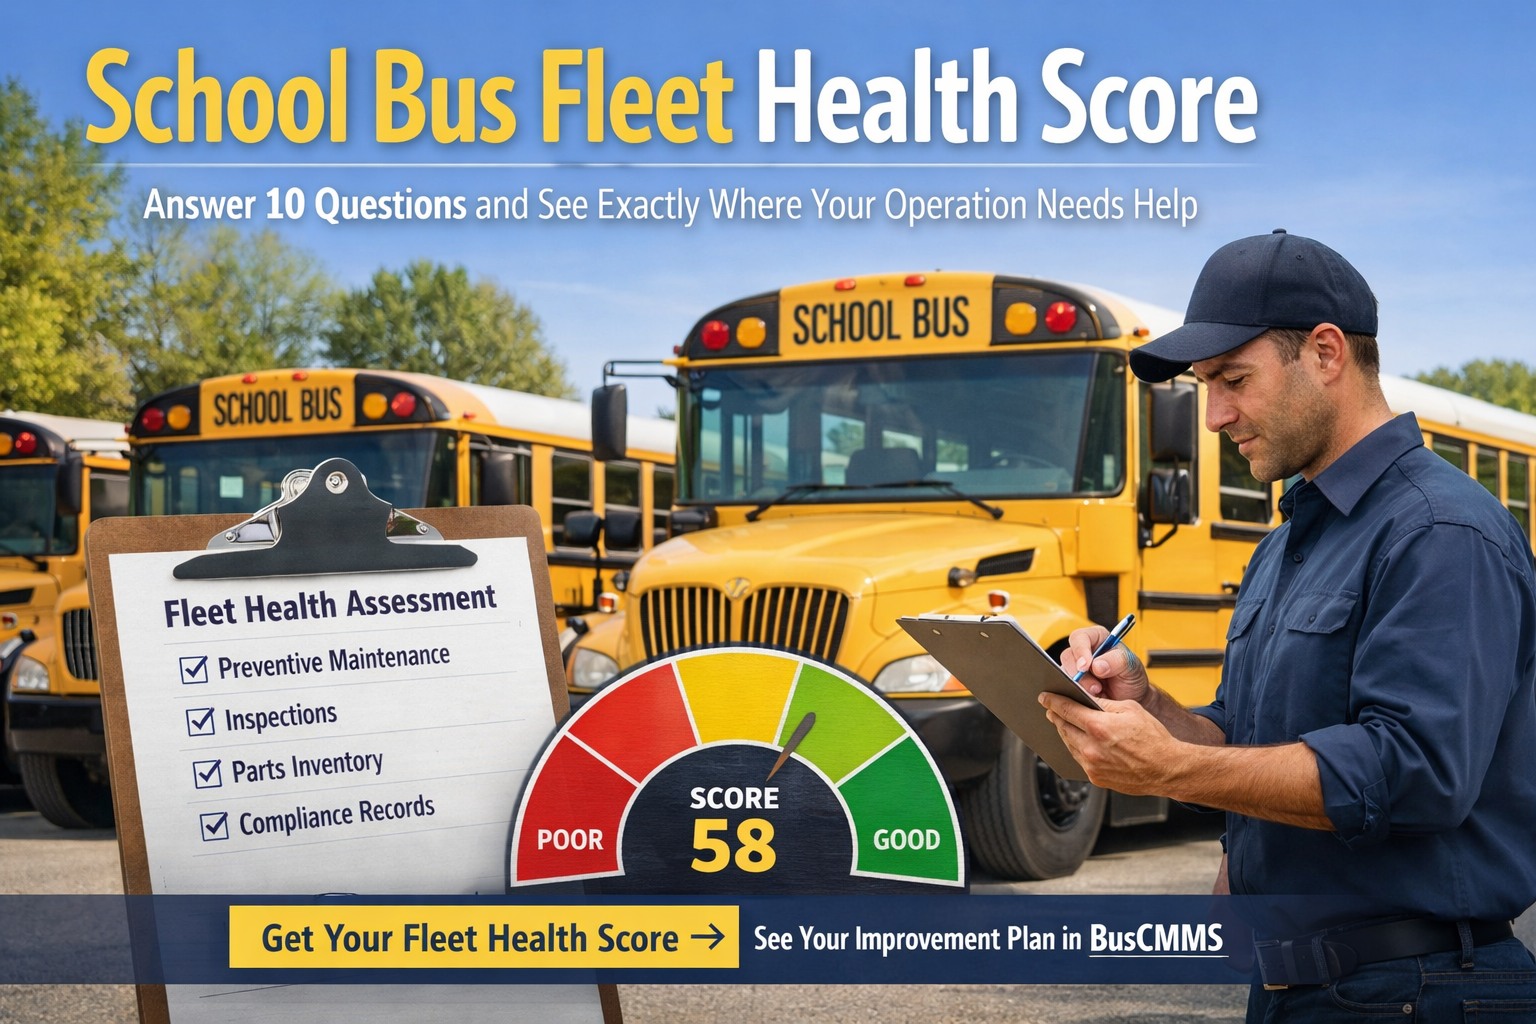
How healthy is your school bus fleet — really? Most transportation directors don't know until an audit fails, a bus breaks down mid-route, or the budget meeting reveals maintenance costs 40% higher than comparable districts. These 10 questions reveal exactly where your operation stands and what to fix first.
School Bus Fleet Health Score: 10 Questions That Reveal Your Biggest Risk Areas
Answer honestly. Your score shows exactly where your fleet needs help — and what improvements deliver the fastest ROI.
What Your Fleet Health Score Measures
This assessment evaluates the 5 pillars that determine whether your fleet runs smoothly — or bleeds money and fails audits:
PM Compliance
On-time preventive maintenance
Inspections
DVIR & annual inspection process
Parts & Inventory
Stock levels & tracking
Documentation
Audit-ready records
Cost Control
Maintenance spend efficiency
The 10-Question Assessment
Score each question 0-10 based on your current operation. Be honest — this is for you, not us.
What percentage of your PM services are completed on time (within mileage/date window)?
How do you track when each bus is due for PM service?
How quickly does a driver-reported defect become a work order?
Can you produce 14 months of DVIR records for any bus in under 5 minutes?
How often do repairs wait because a needed part isn't in stock?
Do you know your current parts inventory value and turnover rate?
If DOT audited you tomorrow, how confident are you in passing?
How complete is your maintenance history for buses over 5 years old?
Do you know your exact cost-per-mile for each bus?
What's your ratio of planned vs. unplanned maintenance?
Want Your Score Calculated Automatically?
BusCMMS analyzes your fleet data and generates a real-time health score across all 5 pillars — plus a prioritized improvement plan.
Score Interpretation
Your fleet is at serious risk
Expect DOT audit failures, unexpected breakdowns, and maintenance costs 40-60% above benchmark. Reactive repairs are draining your budget. Immediate action required.
Fix first: Implement PM scheduling + digital inspections
You're managing, but gaps exist
Some processes work, others don't. You're probably passing audits but spending too much on emergency repairs. Documentation is inconsistent. Room for significant improvement.
Fix first: Connect inspections to work orders + track parts
Your operation is running well
PM compliance is high, records are audit-ready, and you know your costs. Focus on optimization: fuel tracking, predictive maintenance, and replacement planning.
Next level: Integrate telematics + advanced analytics
Industry Benchmarks: Where Do You Stand?
PM On-Time Rate
Cost Per Mile
Planned vs Unplanned
DOT Pass Rate
Book a demo — we'll benchmark your fleet against similar districts →
Quick Wins by Score Range
If You Scored 0-40
If You Scored 41-70
If You Scored 71-100
Sign up free — BusCMMS generates your improvement plan automatically →
What Top-Performing Fleets Do Differently
Get Your Real Fleet Health Score — Calculated From Your Actual Data
Stop guessing. BusCMMS connects to your fleet and generates a live health score with specific improvement recommendations ranked by ROI impact.
What's a good fleet health score for a school district?
A score of 71-100 indicates a healthy operation with strong PM compliance, audit-ready documentation, and controlled costs. Most districts score 45-65 on their first assessment — meaning significant room for improvement. Top-performing districts consistently score 85+.
How often should I reassess my fleet health?
Quarterly assessments catch issues before they compound. Many districts do a full assessment in August (before school), December (mid-year), March (budget planning), and June (end-of-year). With CMMS software, you can monitor your score in real-time rather than periodic assessments.
What's the fastest way to improve a low score?
The fastest impact comes from digitizing inspections (immediate defect visibility) and implementing PM scheduling (prevents 85% of breakdowns). These two changes alone typically move fleets from "Critical" to "At Risk" within 90 days.
How does BusCMMS calculate fleet health automatically?
BusCMMS tracks PM compliance rates, inspection completion, defect resolution time, parts availability, documentation completeness, and cost-per-mile for every bus. The dashboard shows your real-time score across all 5 pillars with drill-down into specific problem areas.
Can I compare my score to similar districts?
Yes. During a demo, we can benchmark your fleet against districts of similar size, region, and fleet age. This helps identify whether gaps are operational or resource-based, and prioritizes improvements that deliver the most value for your specific situation.







