Ask most parts rooms which supplier is their best and you'll get an opinion, not an answer — "we've used them forever," "their rep is great," "they're cheap." But cheap doesn't help when the part shows up two weeks late and a bus sits waiting, and a great rep doesn't offset a 15% return rate. A bus parts supplier scorecard replaces those gut calls with numbers: fill rate, lead time, price, returns, and quality, scored the same way for every vendor, so you finally know who actually earns your orders and who's quietly costing you.
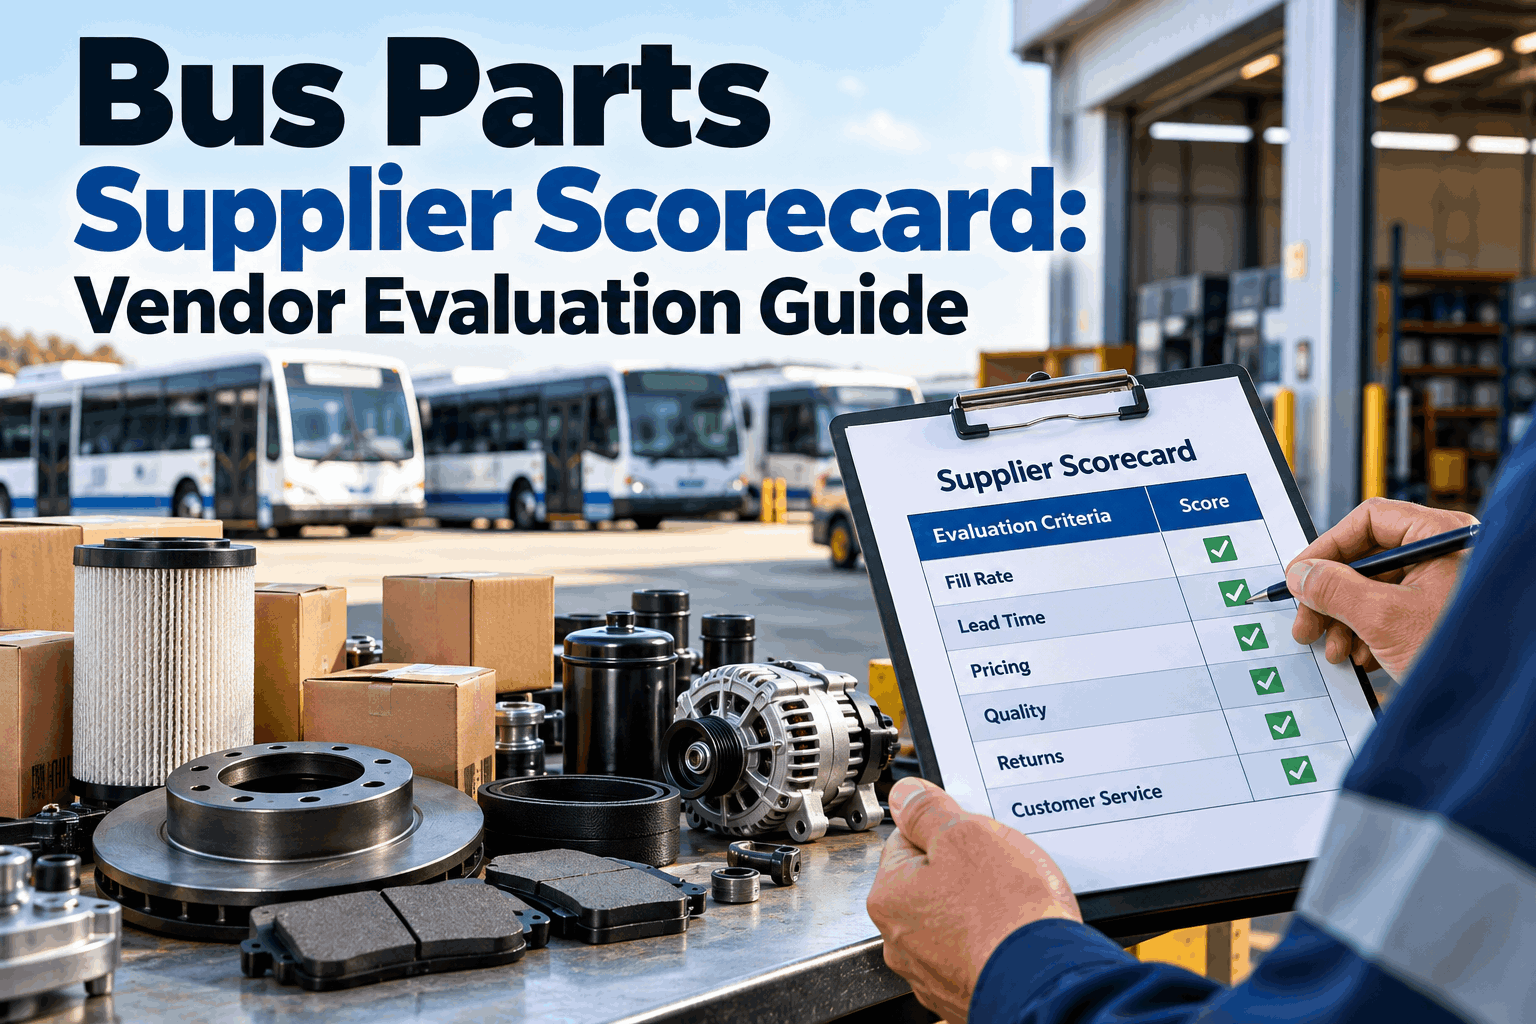
Bus Parts Supplier Scorecard: A Vendor Evaluation Guide
Stop ranking suppliers by relationship and start ranking them by results. Here's how to build a scorecard that measures fill rate, lead time, price, returns, and quality — the same way for every vendor.
Why Gut-Feel Vendor Management Costs You
Most fleets manage parts suppliers by feel, and it works right up until it doesn't. Without an objective way to compare vendors, the loudest rep or the oldest relationship wins the orders — not necessarily the supplier delivering the best results. The costs of that hide in plain sight: a late part that grounds a bus, a cheap unit that comes back defective, a price creep nobody noticed. None of it shows up as a single obvious problem, which is exactly why it goes unmanaged.
Late Parts Ground Buses
A supplier who quotes three days and delivers ten leaves a bus down and a route uncovered. If you're not tracking lead time by vendor, you can't see who's chronically late until it's already cost you.
Cheap That Isn't Cheap
The lowest price loses its shine when 15% of the order comes back defective or wears out early. Without a return and quality metric, "cheapest" gets mistaken for "best value" every time.
Price Creep Goes Unseen
A vendor who nudges prices up a little each order can quietly become your most expensive source. Without tracking price paid over time, the creep is invisible until the budget review.
No Leverage to Negotiate
Walking into a contract review with "you feel expensive" gets you nowhere. Walking in with "your fill rate is 78% and your lead time slipped 40% this year" gets you a better deal or a better vendor.
The through-line is that vendor performance is measurable, and anything measurable can be managed — but only once you actually measure it. A bus parts supplier scorecard turns supplier management from a collection of impressions into a ranked, defensible picture of who delivers. It's the same discipline a good vendor management program is built on, focused specifically on the ongoing performance measurement that keeps your best suppliers earning their orders. And it starts with agreeing on what to measure. Book a demo to see supplier performance measured from your own order data.
The 5 Metrics That Belong on a Bus Parts Supplier Scorecard
A scorecard is only as good as the metrics on it. Track too many and it's noise; track the wrong ones and it misleads. These five capture what actually matters about a parts vendor — whether they deliver what you need, when you need it, at a fair price, without defects.
Fill Rate
The percentage of what you ordered that actually shipped complete and on the first try. A high fill rate means fewer backorders and partial shipments — the foundation of a reliable supplier.
Lead Time & Reliability
Not just how fast, but how consistent — quoted lead time versus actual, tracked over time. A vendor who's reliably five days beats one who's sometimes two and sometimes twelve.
Price Competitiveness
Price paid per part versus the market and versus other vendors, trended so creep shows up. Price matters — but it's one metric of five, not the whole scorecard.
Return & Defect Rate
How often parts come back wrong, damaged, or dead on arrival. A high return rate erases any price advantage in wasted labor, reorders, and the downtime while you wait for the replacement.
Quality & Warranty
How long the parts actually last and how the vendor handles warranty claims. A supplier whose parts hold up and who stands behind them is worth more than the sticker price suggests.
Notice these five interact rather than stand alone — and that's the point of a scorecard. A vendor can win on price and lose on returns; another can be pricier but so reliable on fill rate and lead time that they cost you less in downtime overall. Judging any one metric in isolation is how fleets end up loyal to a "cheap" supplier who's actually their most expensive once defects and delays are counted. The scorecard's job is to weigh all five together into a single, comparable picture — which means the next question is how to score and weight them. Sign up free and start tracking these five metrics per vendor.
How to Build and Weight the Scorecard
Turning five metrics into a working scorecard takes four steps. The goal is a simple, repeatable score you can run every quarter and trust enough to act on — not a spreadsheet so elaborate nobody maintains it.
Pick Your Metrics and Scales
Start with the five core metrics and define how each is scored — fill rate as a percentage, lead time as quoted-vs-actual, returns as a defect rate. Keep the scales simple and consistent so every vendor is measured the same way.
Weight by What Matters to You
Not every metric matters equally. A fleet fighting downtime might weight fill rate and lead time heaviest; one under budget pressure might weight price higher. Set weights that reflect your real priorities, and the score reflects your fleet.
Score From Real Data, Not Memory
Populate the scorecard from your actual order and receiving history — what was ordered, what arrived, when, at what price, and what came back. A score built on records is defensible; one built on impressions just re-launders the gut feel you're trying to replace.
Rank, Review, and Repeat
Combine the weighted metrics into one score per vendor, rank them, and review on a set cadence — quarterly works for most fleets. The trend over time matters as much as the snapshot: a vendor sliding down the list is a signal to act early.
The weighting step in particular is what makes a scorecard yours rather than generic. Two fleets can track the identical five metrics and rightly reach different vendor rankings because their priorities differ — downtime-sensitive operations value reliability over the last few dollars, while a tightly budgeted district may accept slightly longer lead times for a real price break. There's no universally correct weighting; there's only the one that matches what your fleet actually needs. And once the score is built on real data and reviewed on a rhythm, it stops being a one-time audit and becomes an early-warning system for vendor performance. Book a walkthrough to see a weighted supplier scorecard built on your data.
How to Act on the Scores
A scorecard nobody acts on is just a report. The value is in what you do with the ranking — consolidating toward your best vendors, pushing your middle ones to improve, and moving on from the ones dragging you down. Here's how each score translates into a decision.
The most valuable move here is usually the middle one: sharing the scorecard with a vendor who's slipping. Most suppliers don't know they've fallen off — a rep who hears "your lead time went from five days to eleven this year, here's the data" often fixes it fast, because they don't want to lose the account. That single conversation, backed by numbers, frequently recovers a vendor rather than forcing a costly switch. And when a supplier genuinely can't perform, the scorecard gives you the documented basis to move on without second-guessing — especially important on a passenger fleet, where a chronically unreliable parts source becomes a safety exposure, not just an inconvenience. Sign up free and turn vendor scores into better contract terms.
The Analytics That Populate the Scorecard
A supplier scorecard is only as trustworthy as the data behind it, and the mistake most fleets make is trying to build one by hand — scraping numbers from invoices and memory once a year. The reason scorecards fail isn't the concept; it's the upkeep. BusCMMS solves that by capturing vendor performance as a byproduct of normal parts ordering and receiving, so the scorecard populates itself.
-
Fill-Rate Tracking
Compare what was ordered against what arrived complete, per vendor and over time — so fill rate is a measured number, not an impression of who seems reliable.
-
Lead-Time Measurement
Timestamp every order from PO to receipt, so quoted-versus-actual lead time and its consistency are captured automatically for each supplier.
-
Price History by Vendor
Track price paid per part per supplier over time, so price creep and true competitiveness surface on the scorecard instead of hiding in old invoices.
-
Return & Defect Logging
Record returns and defective parts against the vendor that supplied them, turning quality problems into a hard rate you can rank suppliers by.
-
Part-Life by Source
Tie a part's service life back to its supplier, so "quality" becomes measurable — which vendors' parts actually last on your buses, not just which are cheapest.
-
Vendor Scorecard Reports
Roll the metrics into a ranked, weighted scorecard you can pull anytime — ready for a contract review or a budget meeting, updated from live data.
The reason a purpose-built bus platform matters here is that the scorecard is only useful if the data is captured without extra work. If building it means someone manually logging every order and return, it won't survive a busy month — which is why most manual scorecards die within a year. Because BusCMMS records vendor, price, order and receipt dates, and returns as part of ordinary parts and inventory management, the performance data accumulates on its own, and the scorecard is a report you pull rather than a project you undertake. That's what lets a parts manager walk into a vendor review with a full year of ranked performance instead of a hunch — and it's typically live in two to four weeks.
A Parts Manager's Take
That's a bus parts supplier scorecard doing its job: it surfaced a "best" vendor who wasn't, promoted a quiet performer who was, and gave the numbers to fix the relationship worth fixing. The suppliers didn't change — the visibility did, and with it, the leverage.
The Bottom Line on a Bus Parts Supplier Scorecard
A bus parts supplier scorecard replaces relationship-based vendor decisions with results-based ones, and on a passenger fleet that's not just a cost discipline — it's a reliability and safety one. Track the five metrics that matter (fill rate, lead time, price, returns, and quality), weight them to reflect your fleet's real priorities, and score every vendor the same way from your actual order and receiving data rather than memory. Then act on the ranking: consolidate toward your top performers, share the numbers with the middle to push them up or negotiate better terms, and phase out the ones a passenger fleet can't afford to rely on. The reason most scorecards fail is upkeep — a hand-built spreadsheet dies in a busy month — so the practical key is capturing vendor performance automatically as part of normal parts management, which turns the scorecard from a yearly chore into a live early-warning system. Do that, and you stop hoping your suppliers are good and start knowing which ones are, with the data to keep them that way. Your best vendors earn more of your business, your weak ones improve or exit, and your parts room finally manages suppliers instead of just ordering from them. Book a walkthrough to build a supplier scorecard on a fleet like yours.